
Uptick CRM
Enterprise B2B SaaS • iOS/Android/Web • US market
TL;DR
- Designed CRM workflows that made ML predictions usable and trustworthy for daily decisions and executive forecasting.
- Shipped a 360° Customer View, an embedded Uptick Score (1–100), an exec forecasting pivot, and a mobile-first experience for field sales.
Context
Uptick CRM is built for subscription software companies. A key differentiator is ML-powered prediction of deal health and deal success, used for prioritization and forecasting. The business model relies on enterprise subscriptions justified by better forecasting and decision support.
Sales reps
Sales managers
RevOps
C-level
My role
Product Designer → Senior Product Designer (iOS/Android/Web). I joined early, worked as the only designer for ~2 years, and continued as the company scaled.
- Discovery: interviews, hypothesis testing, synthesis
- Information architecture + interaction design
- Visual design + prototyping
- Handoff, QA, and post-launch iteration
The problem
- Fragmented context: opportunity data scattered across emails/meetings and screens.
- Trust gap for ML: a score is useless if users can’t act on it.
- Field reality: mobile can’t be a “lite” version without decision-critical signals.
Strategy & principles
- Design around decision moments, not around screens.
- Embed ML into workflows with supporting context and drill-down paths.
- Progressive disclosure: scan first → details on demand.
- Smart defaults: ship value early (e.g., predefined filters).
Key trade-off: explainability vs speed. The solution pattern was “fast scan by default + drill-down when needed”.
Walkthrough
Accounts list — prioritize fast
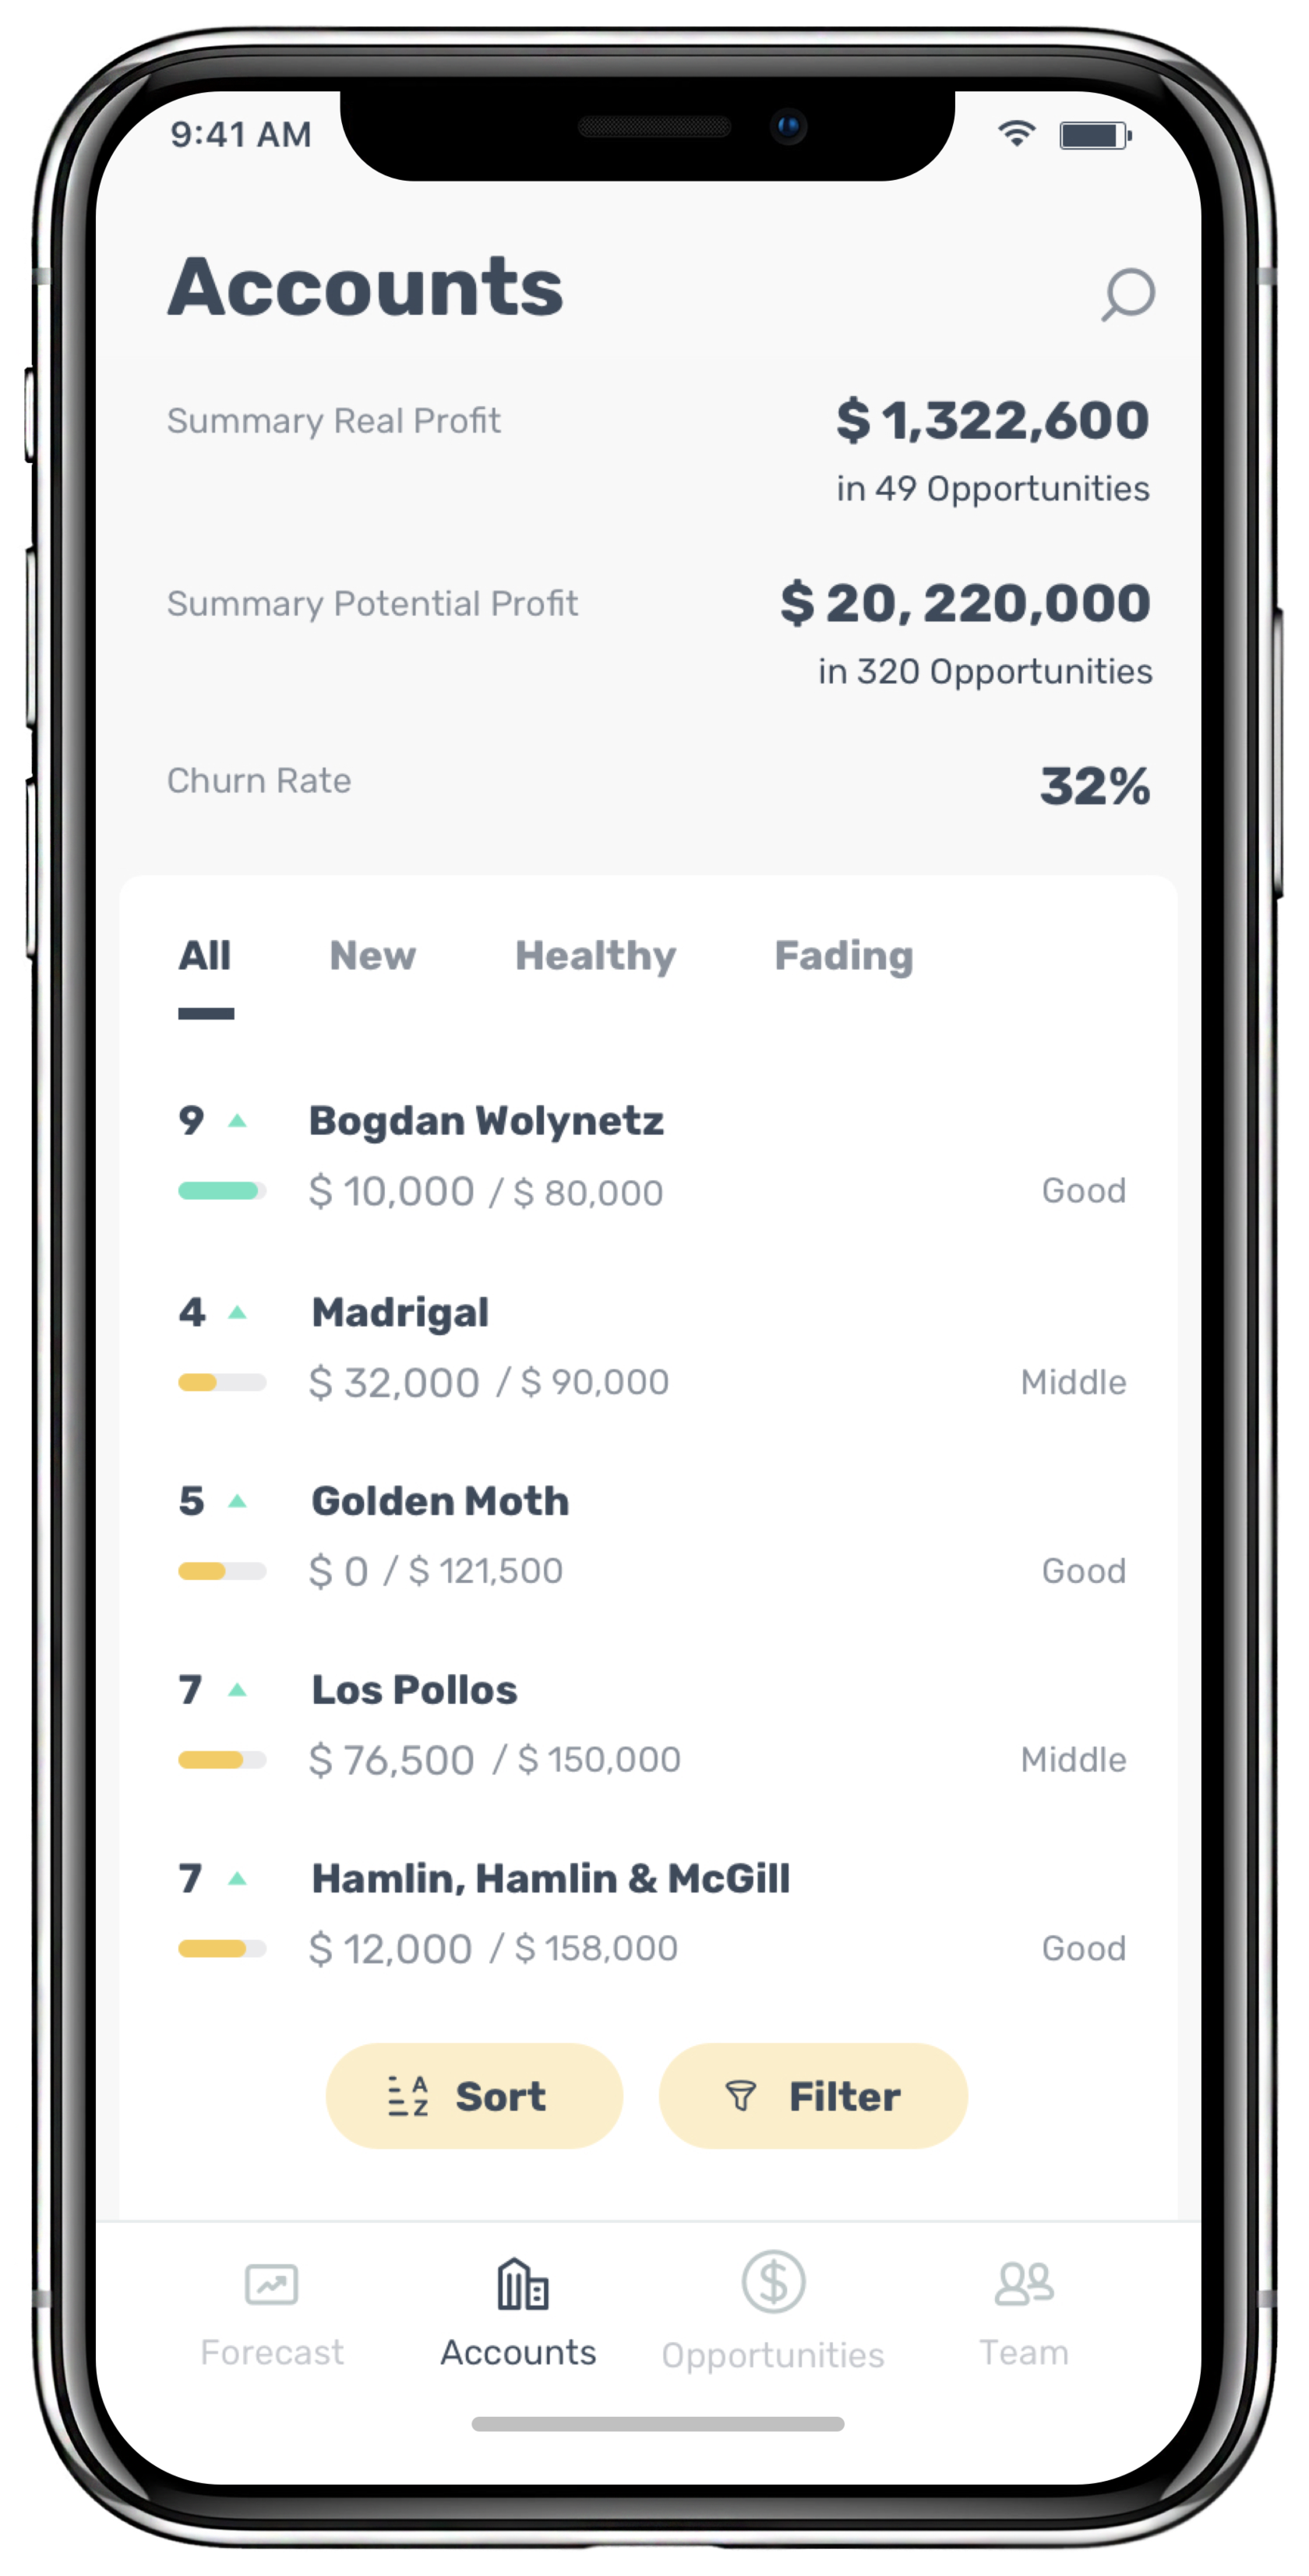
The Accounts list is built for fast prioritization. It combines tiers, potential vs realized value, and health signals (product usage, support usage, engagement) so a rep can quickly decide what deserves attention.
Scanability: key values and health signals are visible without opening details.
Smart defaults: predefined filter presets cover common workflows (e.g., risk, renewals).
Reason, not just ranking: the list explains why an account is “healthy” or “fading”.
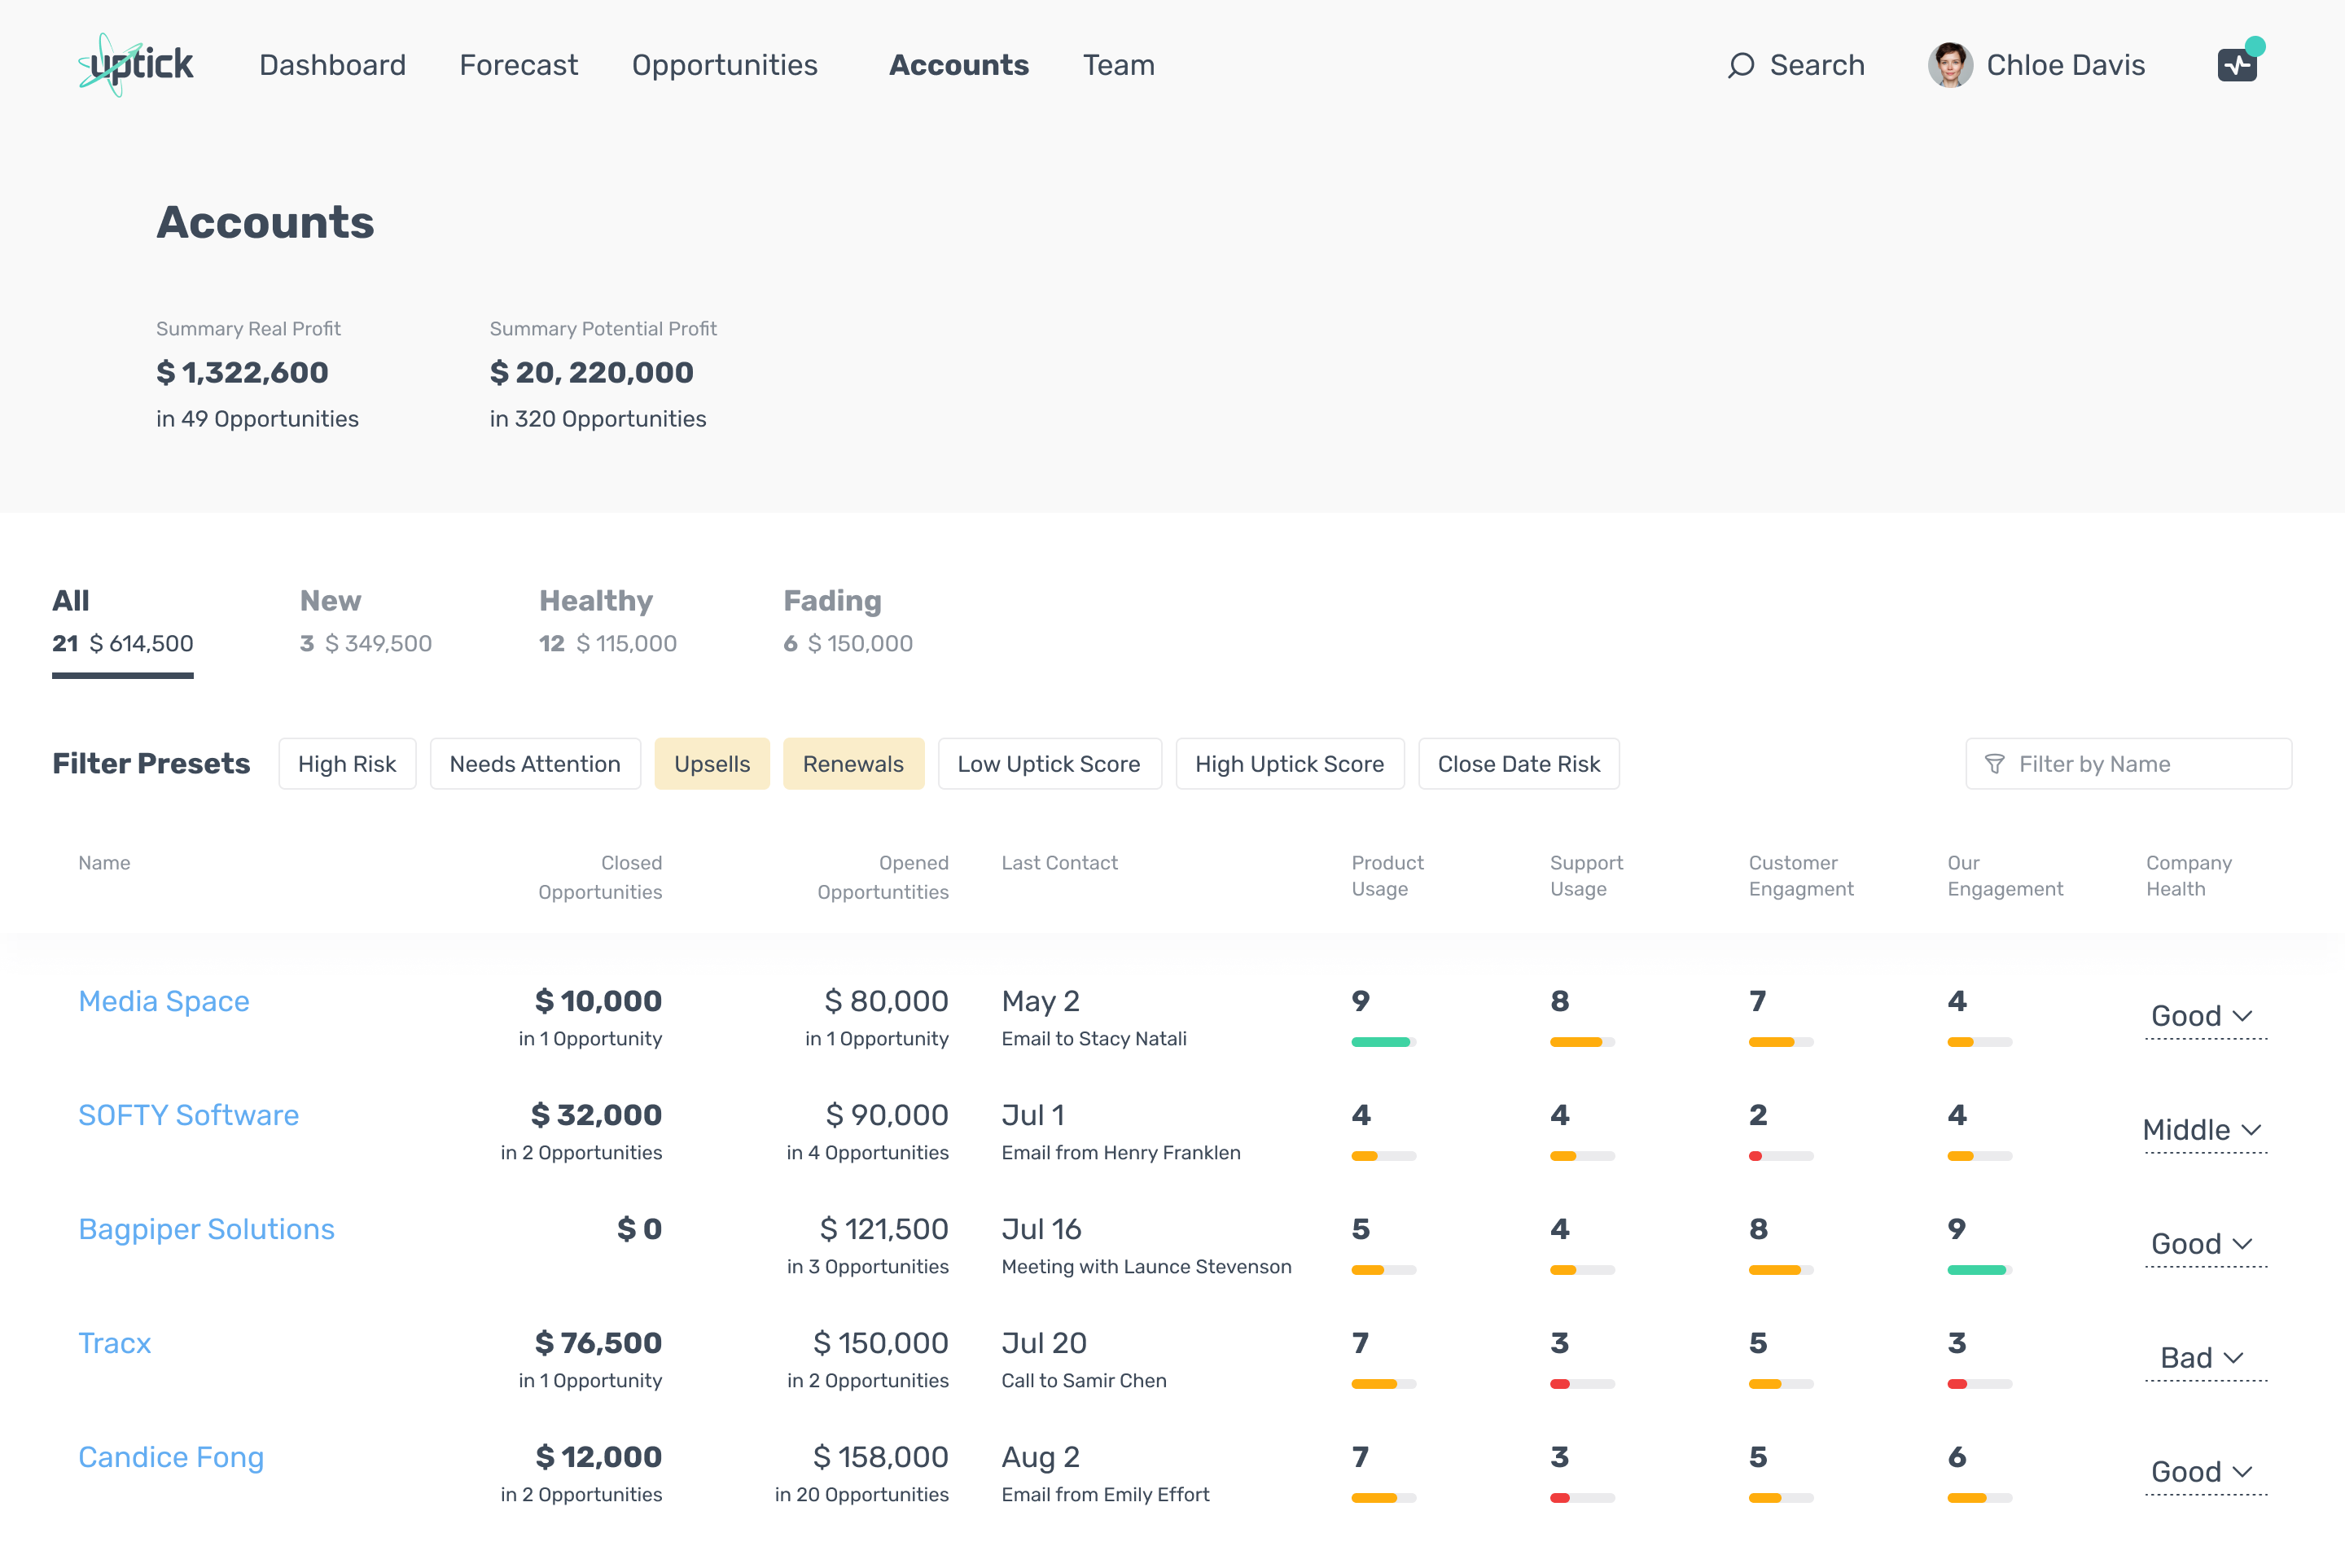
Accounts list (tiers + health signals + filter presets).
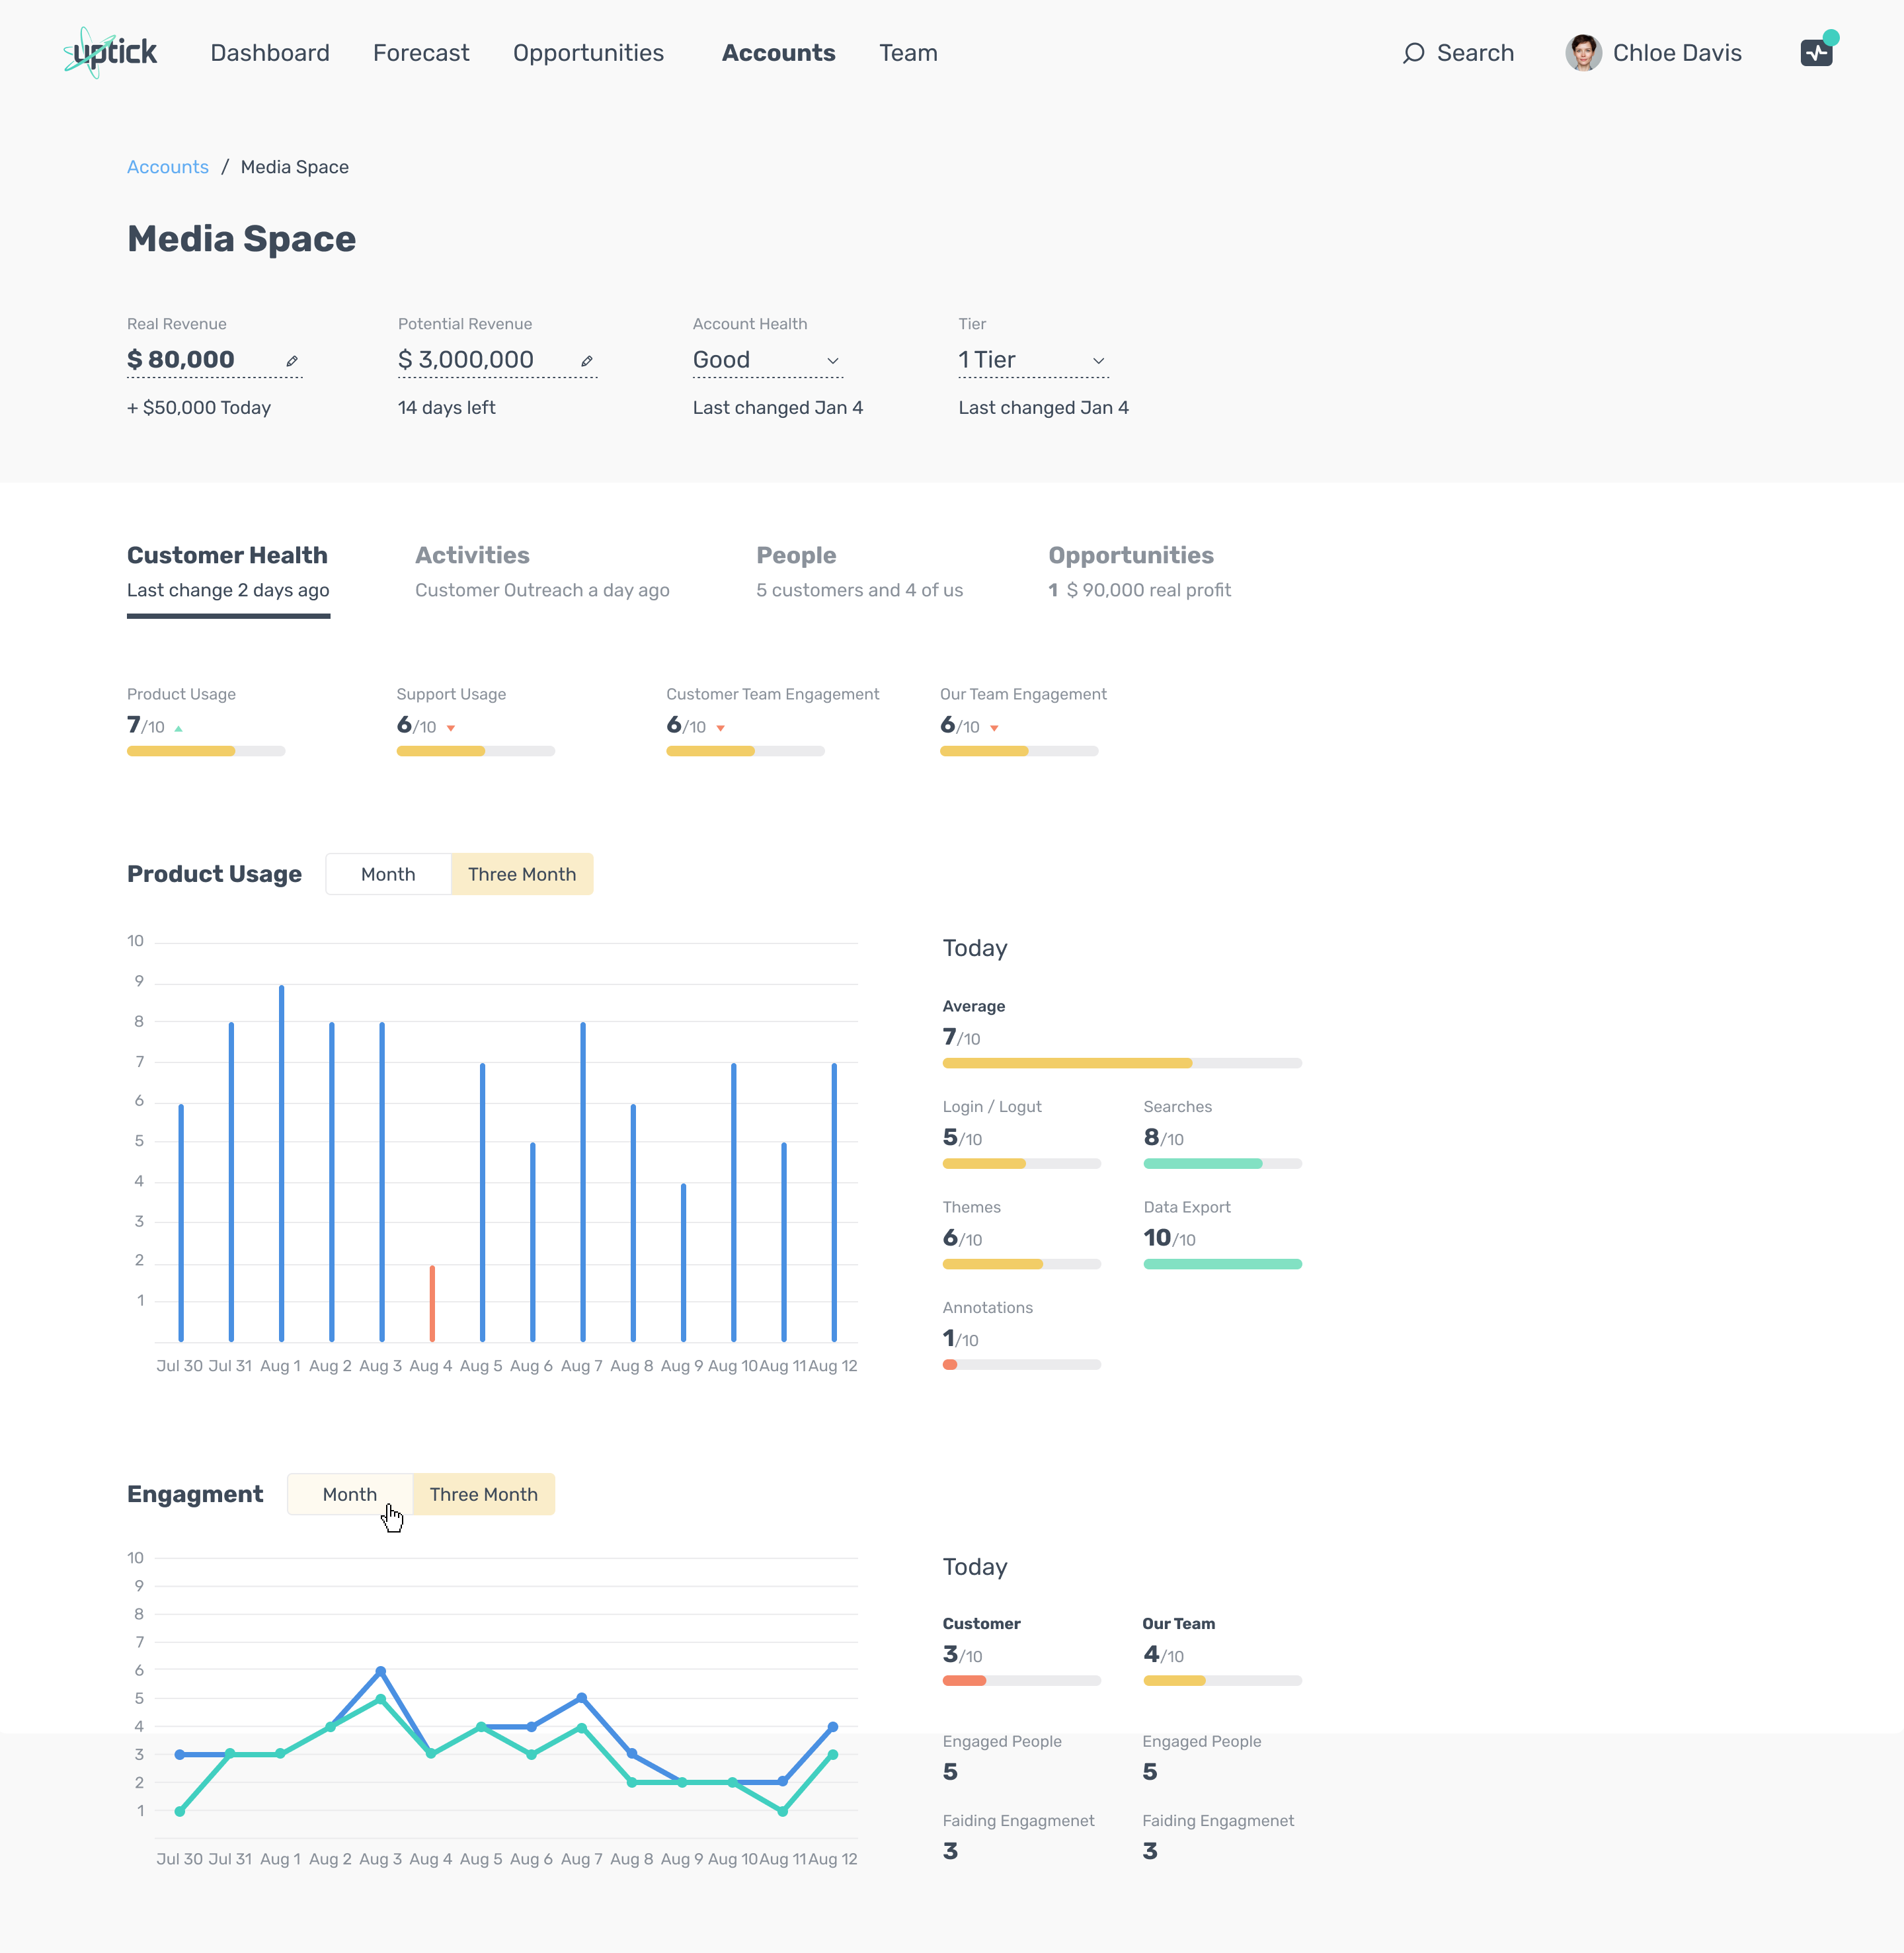
Account details — progressive disclosure
Account details use tabs (Customer Health / Activities / People / Opportunities) and “teasers” to allow scanning before diving deeper. The goal: speed for daily work, depth when needed.
Scan first: summary health signals and trends visible immediately.
Drill down: details available without turning the page into a “data wall”.
Opportunities list (forecast categories + close dates + health signals).
Opportunities list — reduce spreadsheet fatigue
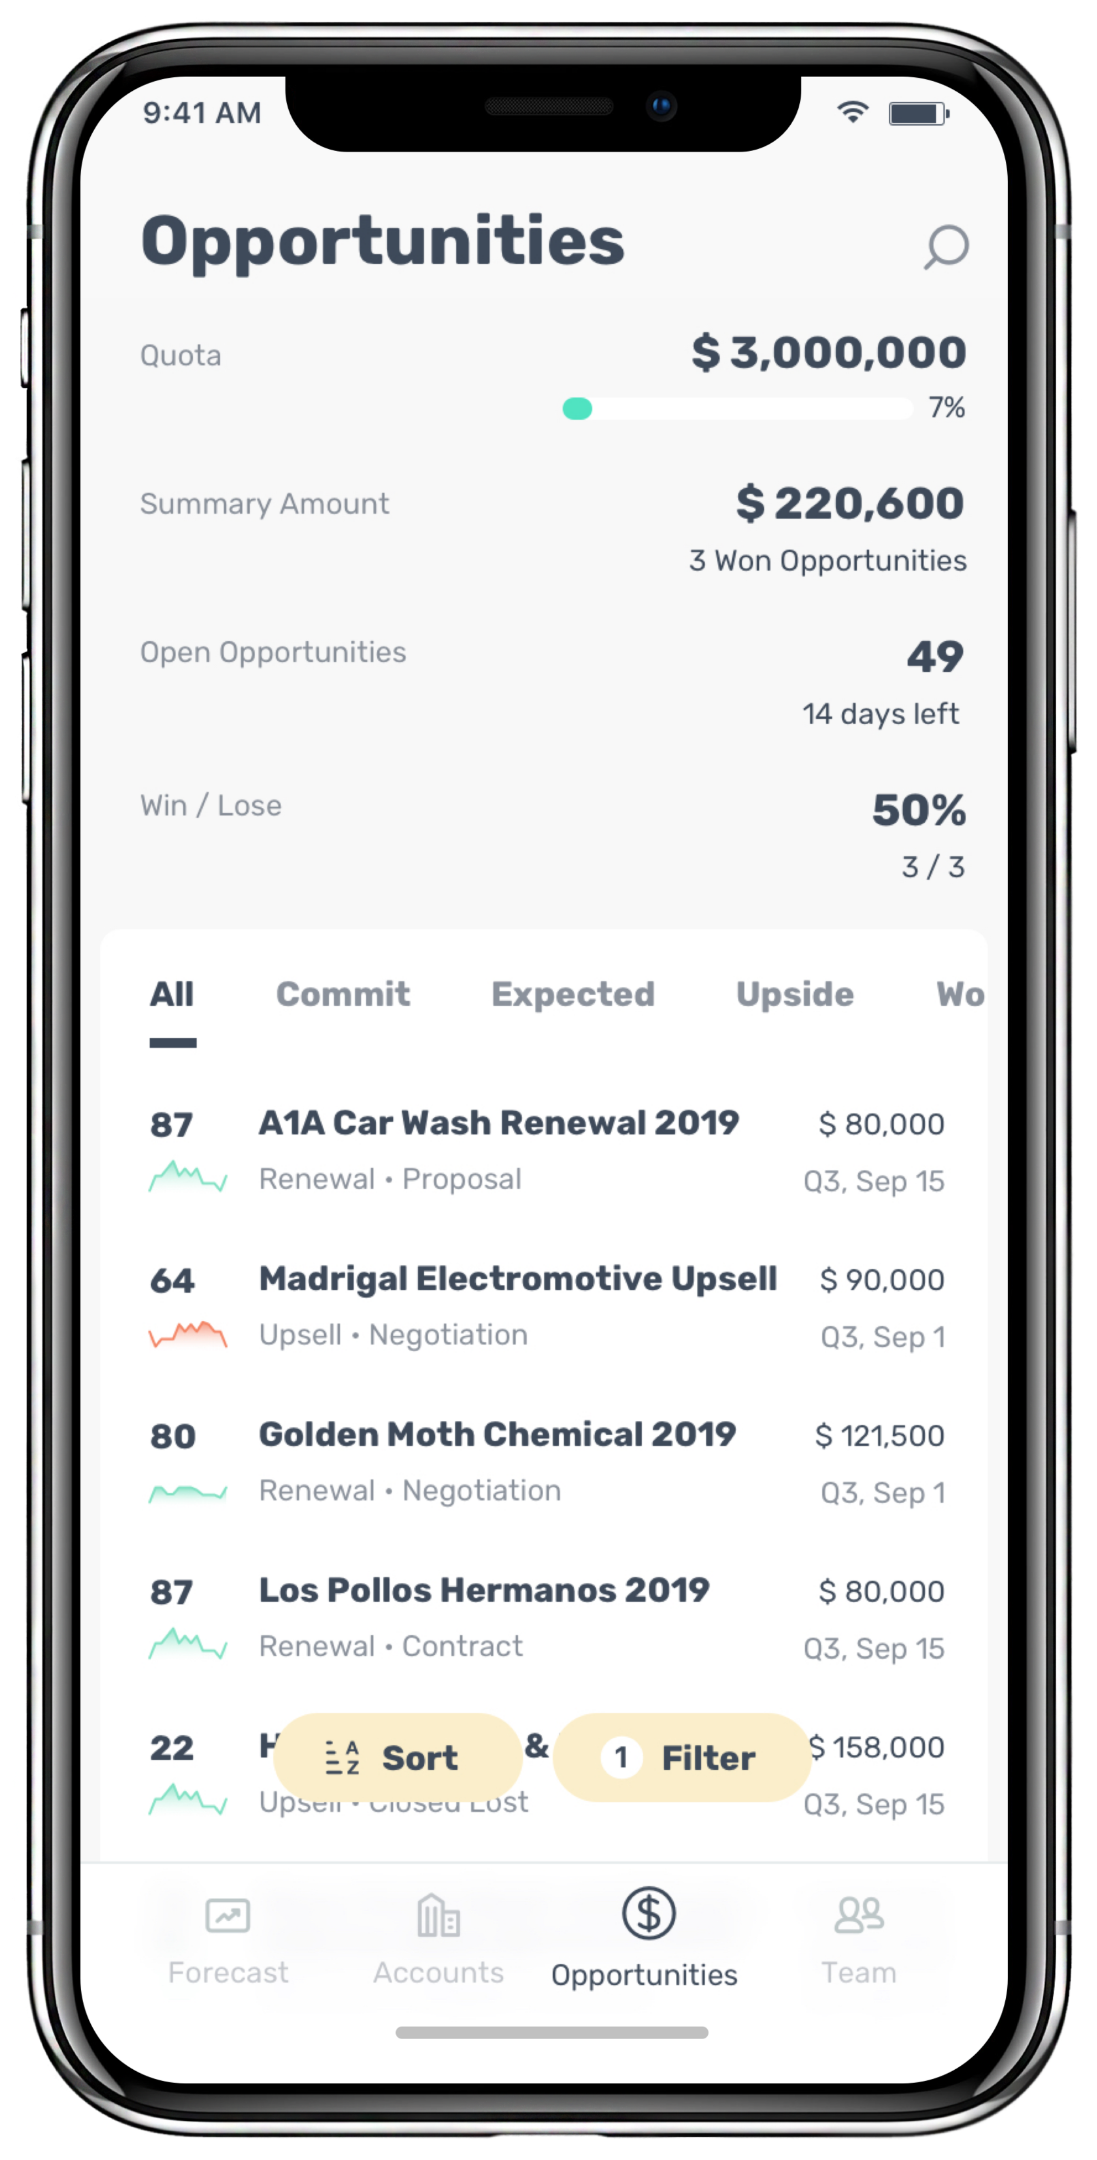
Opportunities are structured around how sales actually works: amount + close date + stage, plus a clear forecast category (commit/expected/upside). This makes “what to do next” easier than scanning an endless table.
Workflow segmentation: forecast categories match real decision-making.
Actionable signals: quick health/usage indicators provide context without drilling down.
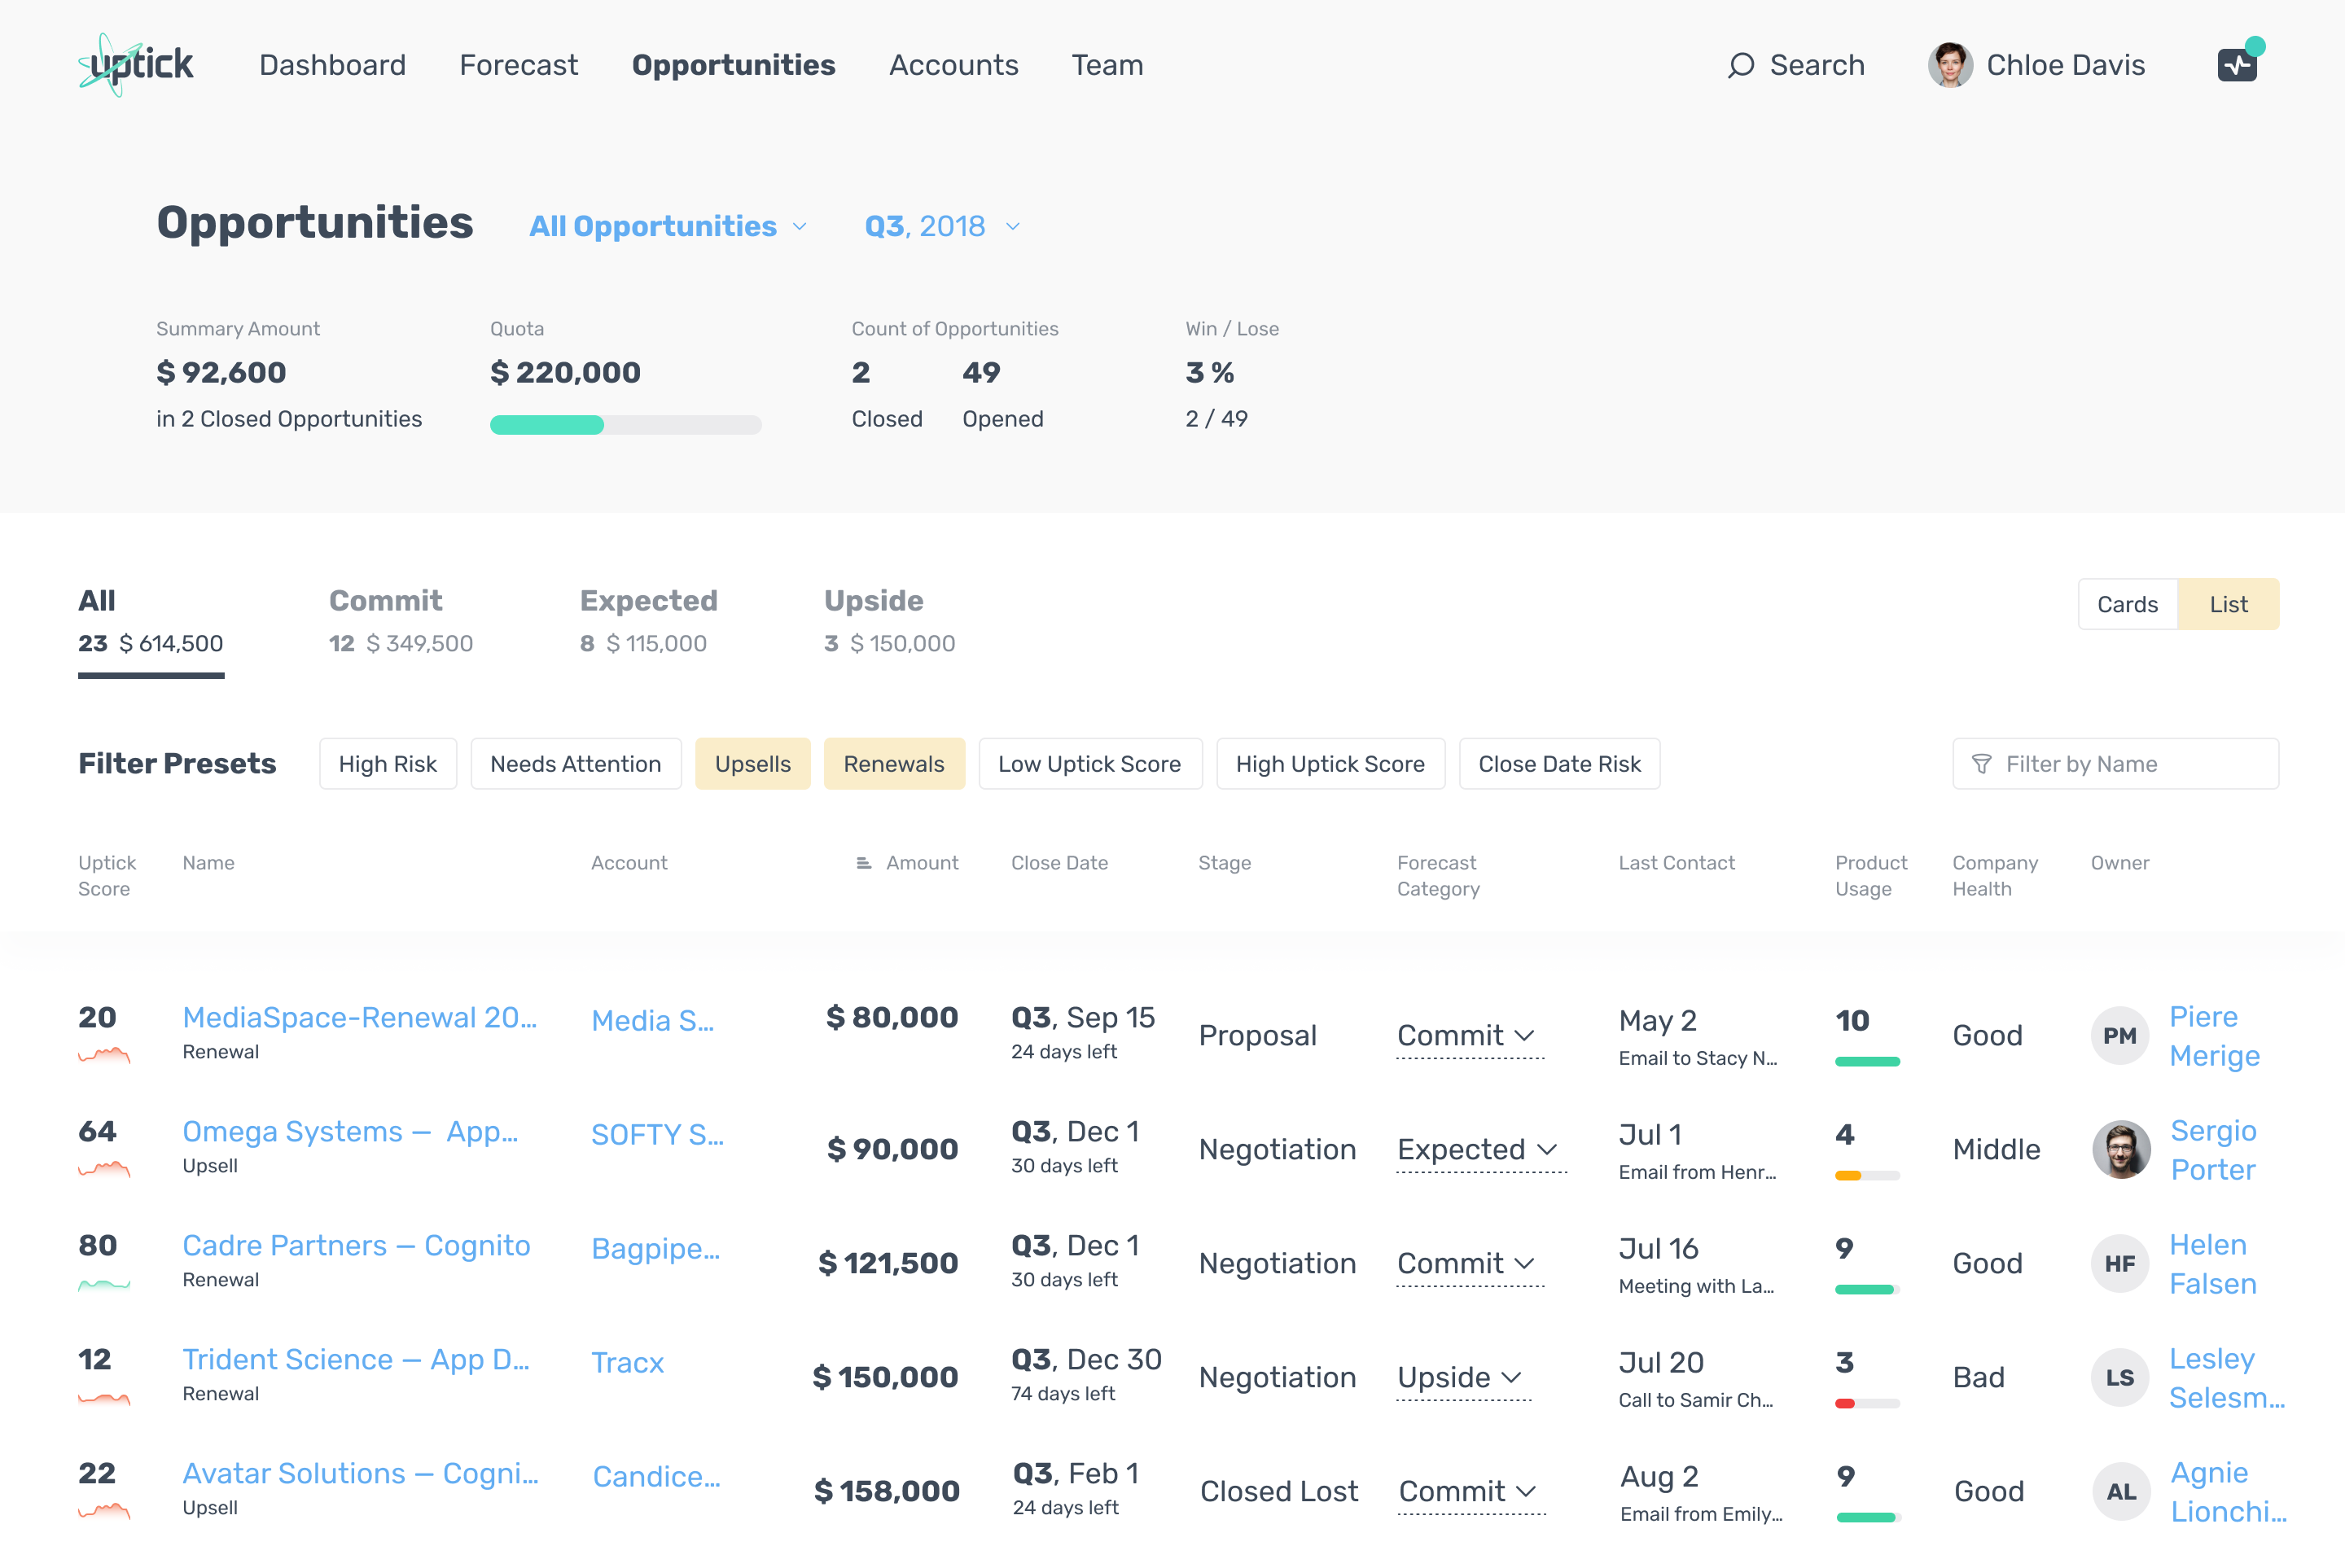
Opportunities list (forecast categories + close dates + health signals).
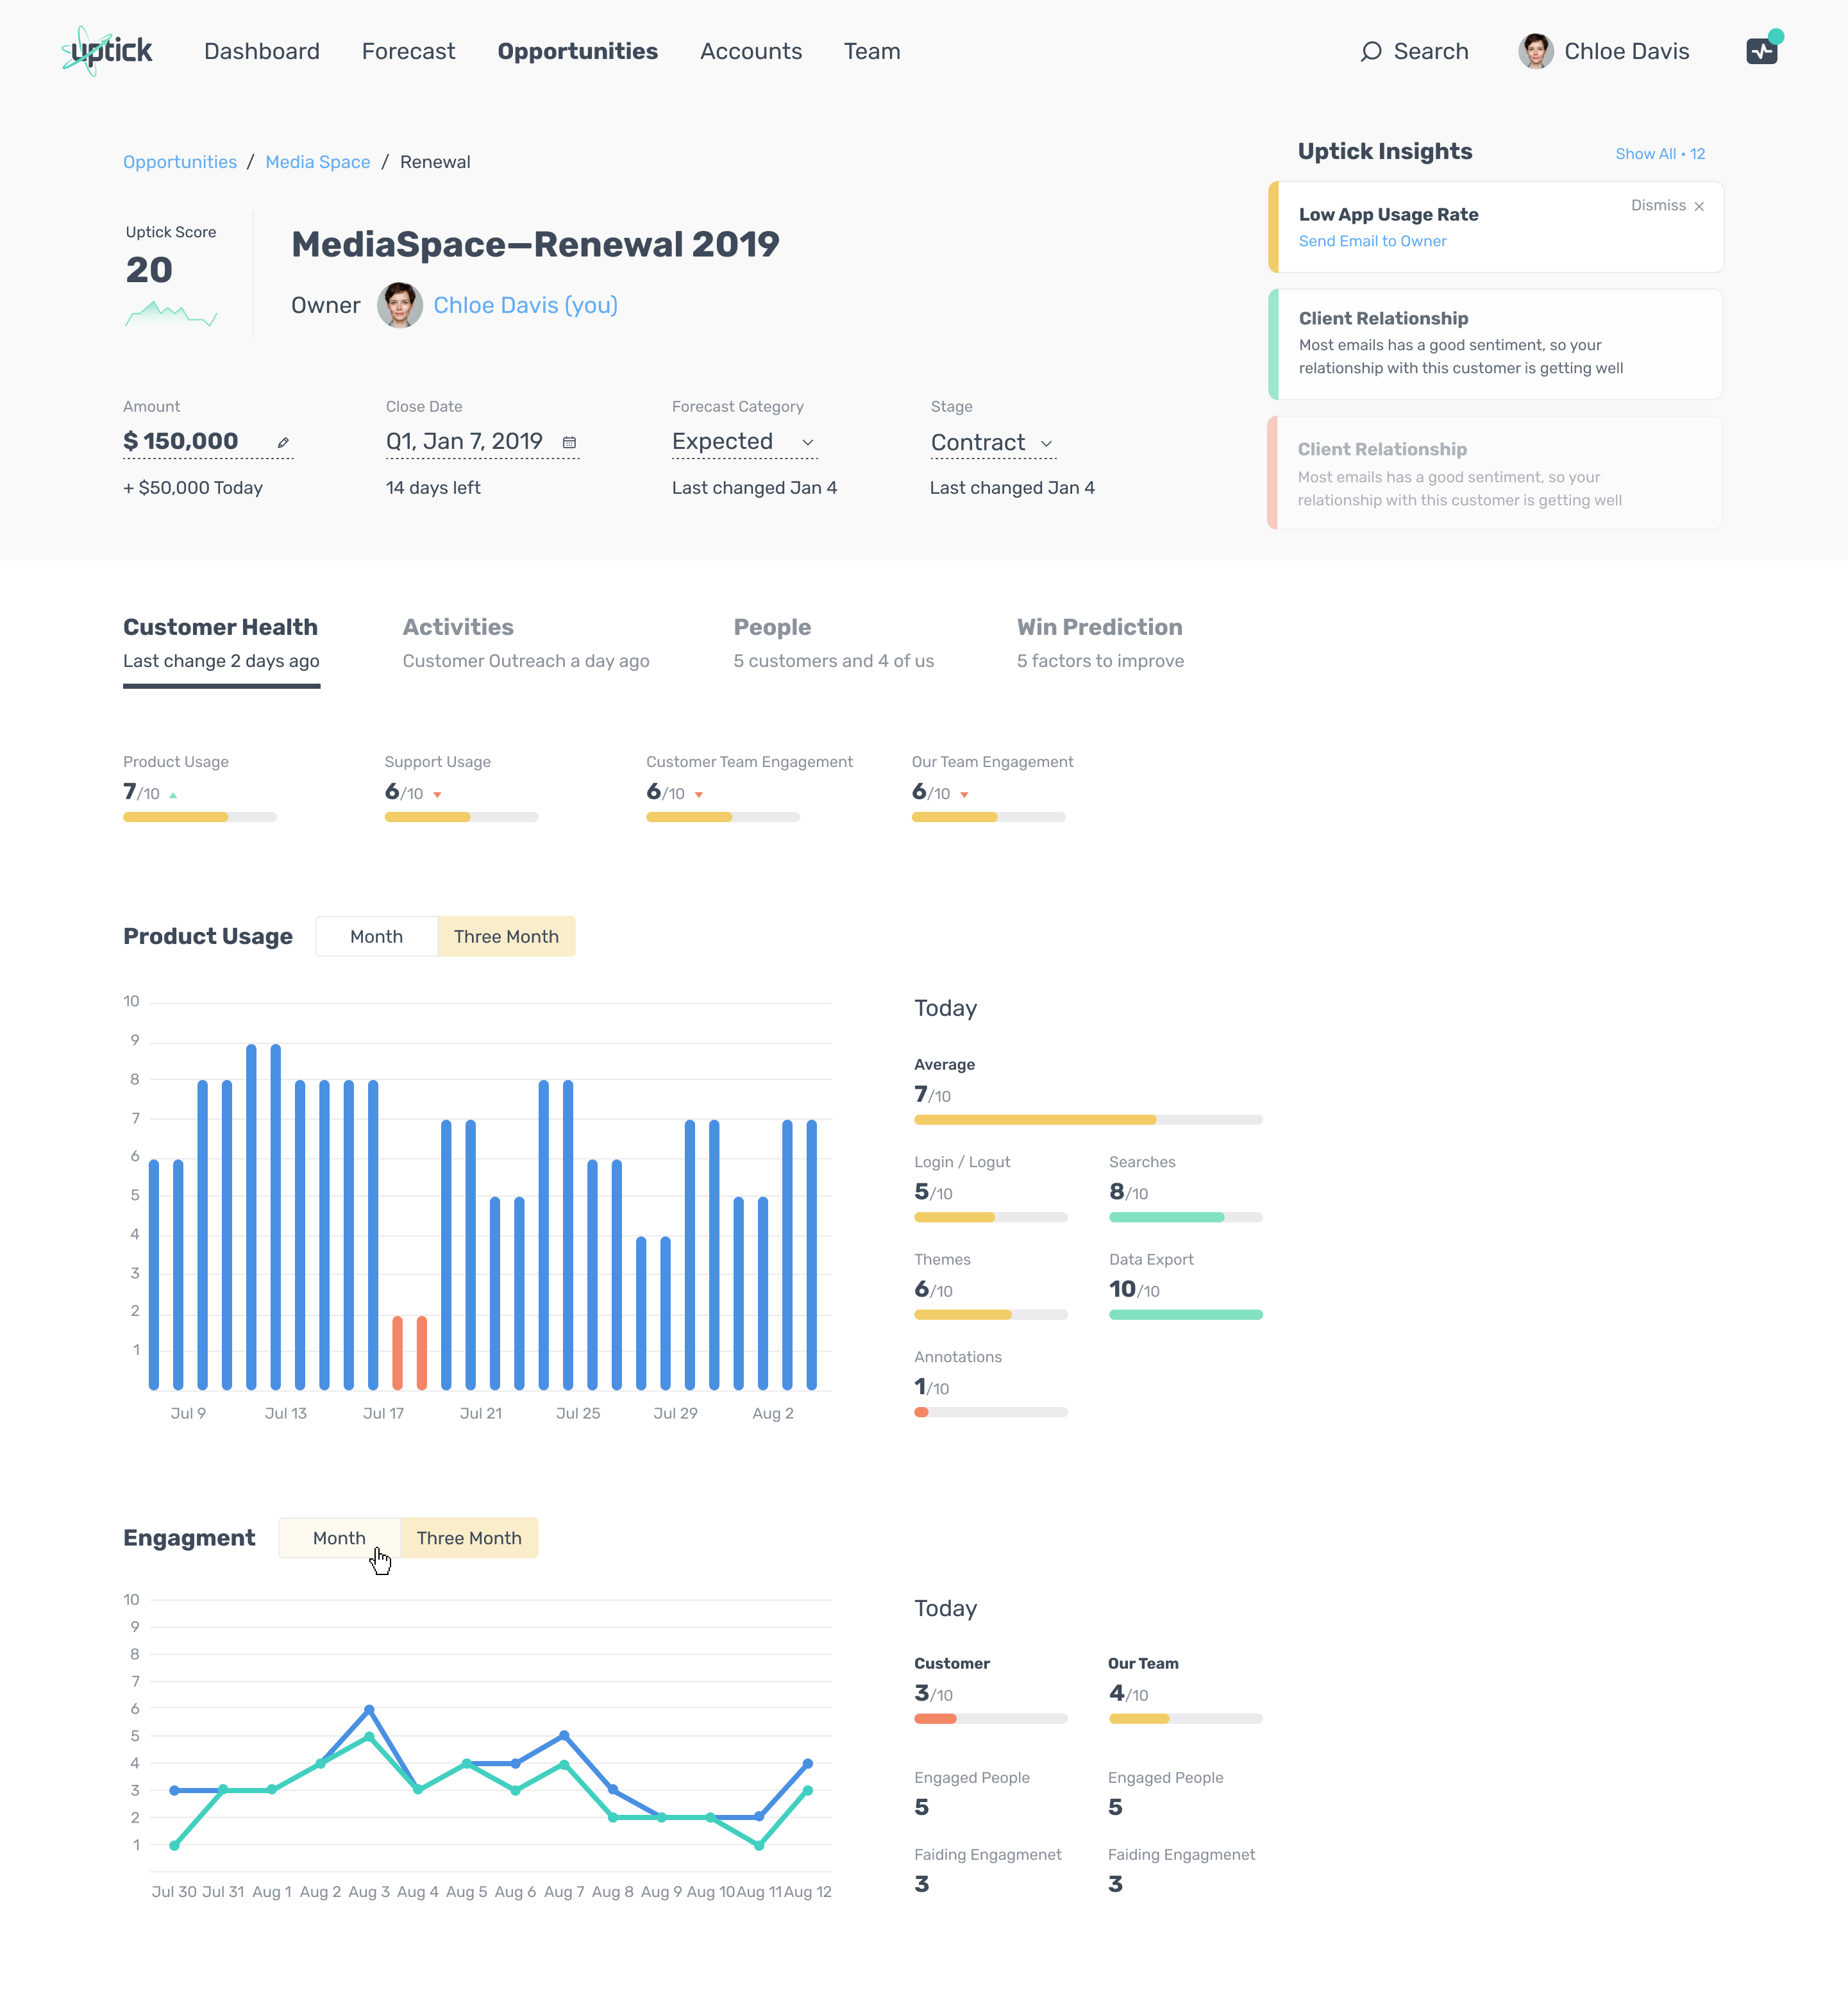
Opportunity 360° view — one place to decide
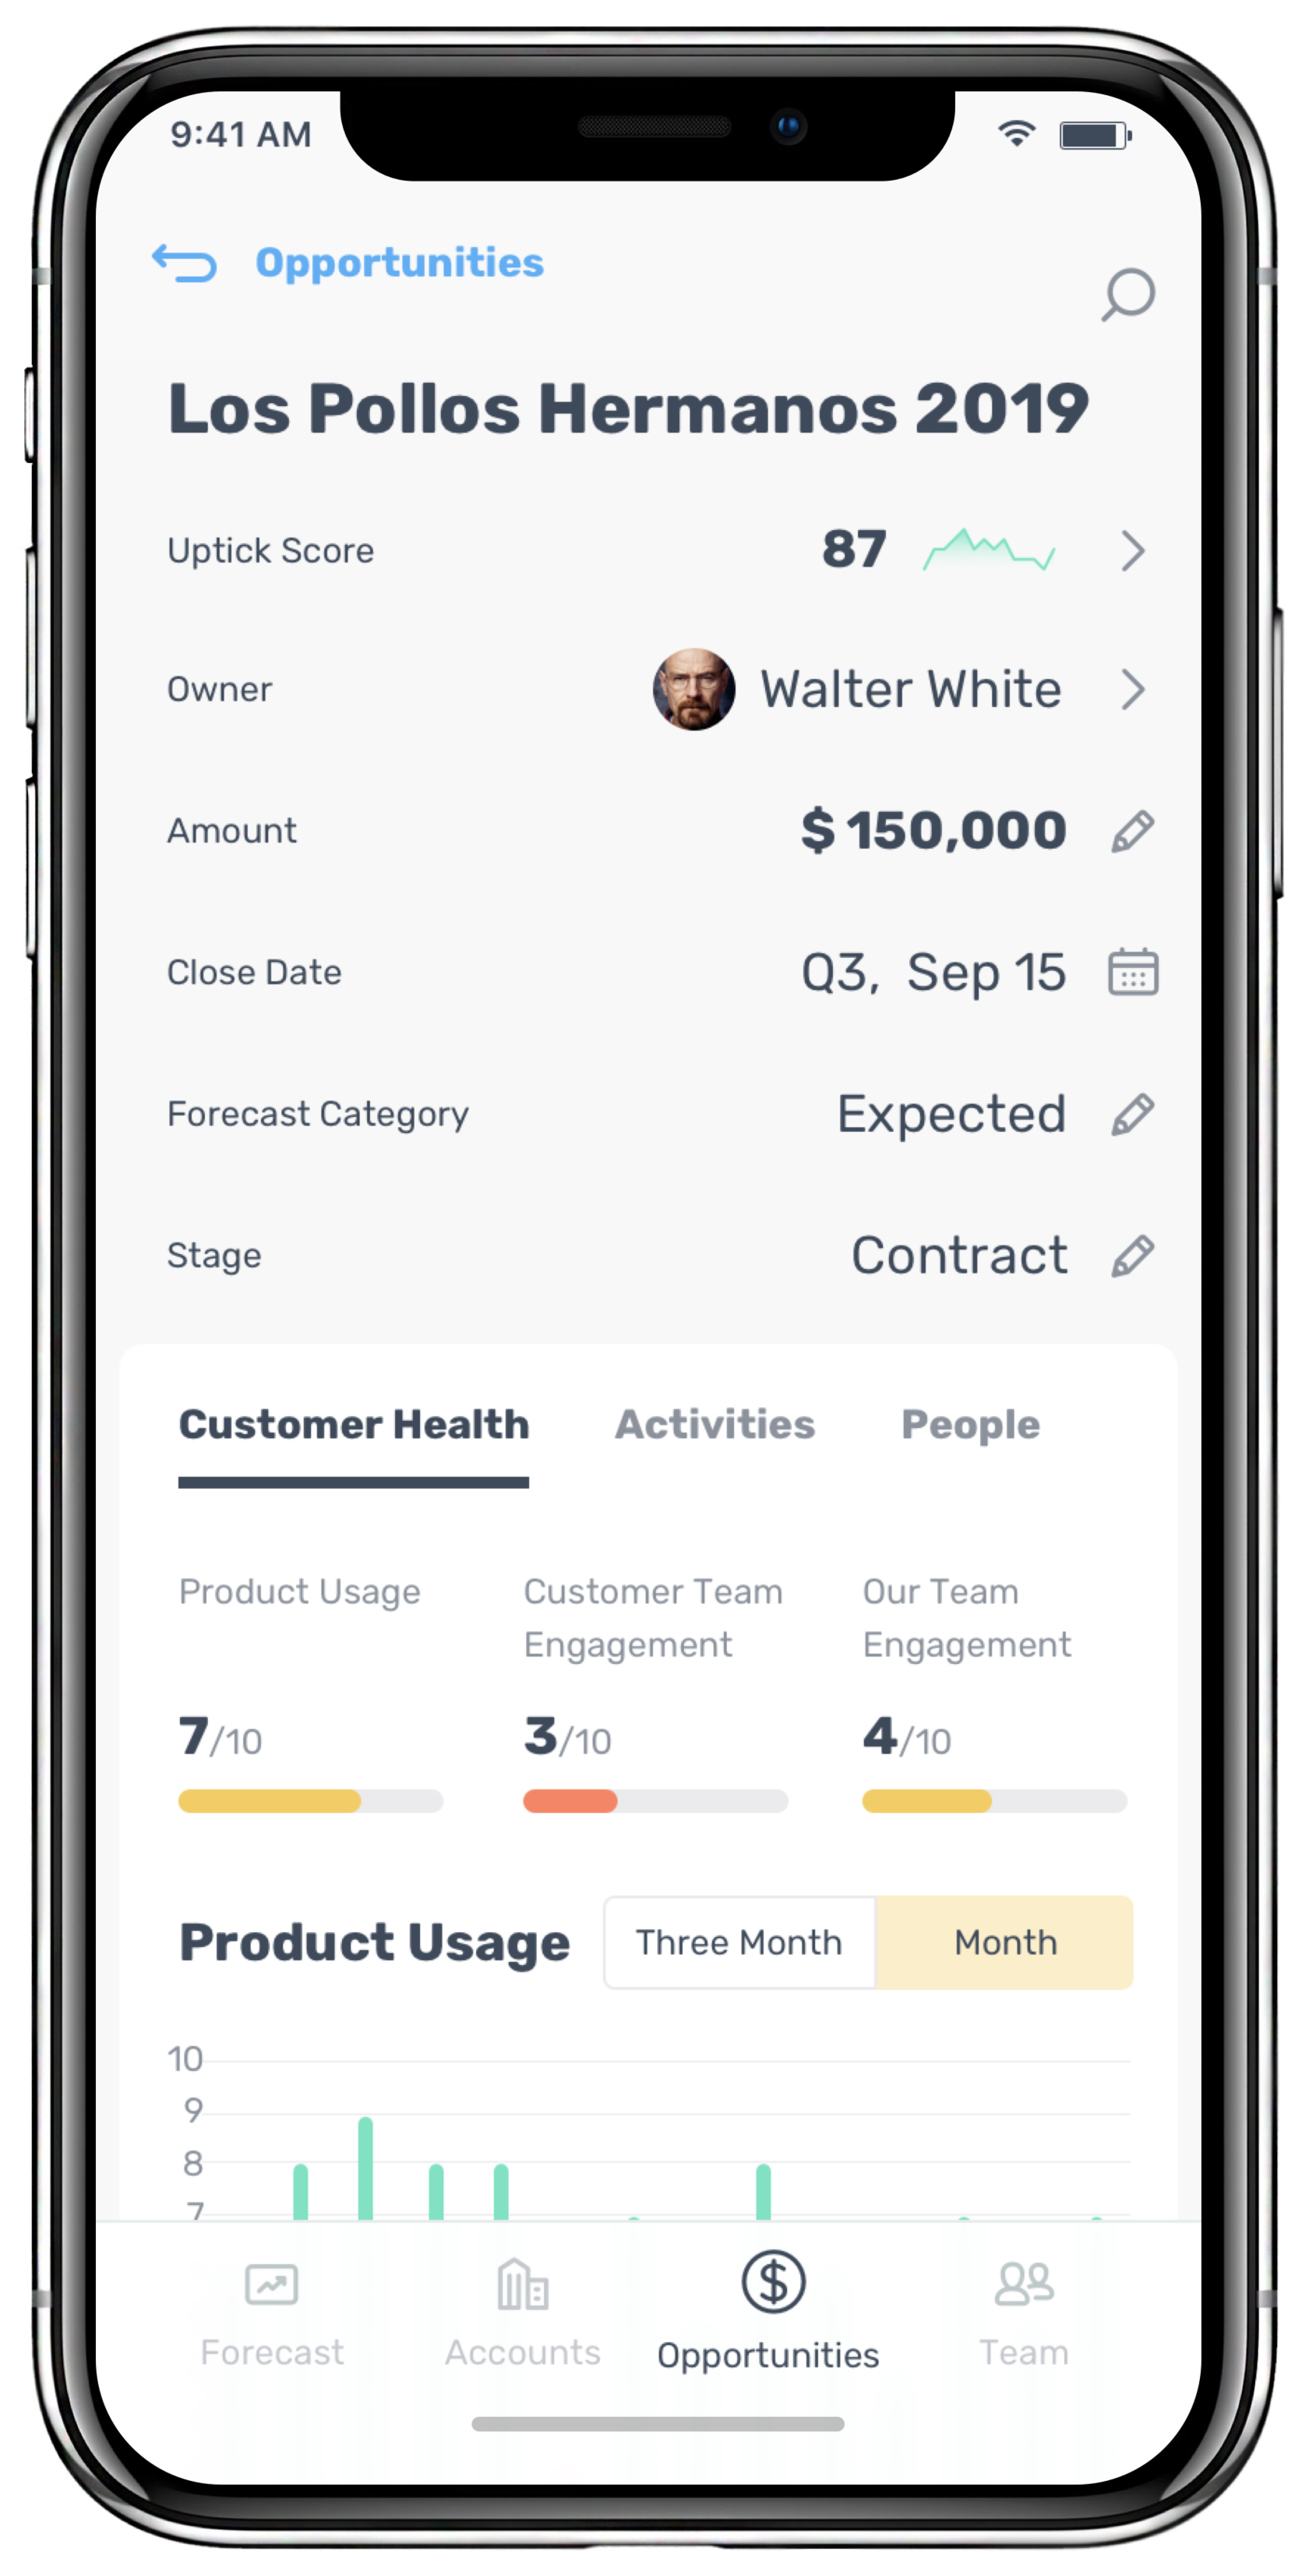
The 360° view brings the decision context together: opportunity meta, health signals, trends, and navigation to Activities and People. The Uptick Score is embedded into this workflow rather than living on a separate “AI” page.
Less context switching: fewer jumps between CRM and external tools.
ML inside the workflow: fast scan, with drill-down via health/activity/people context.
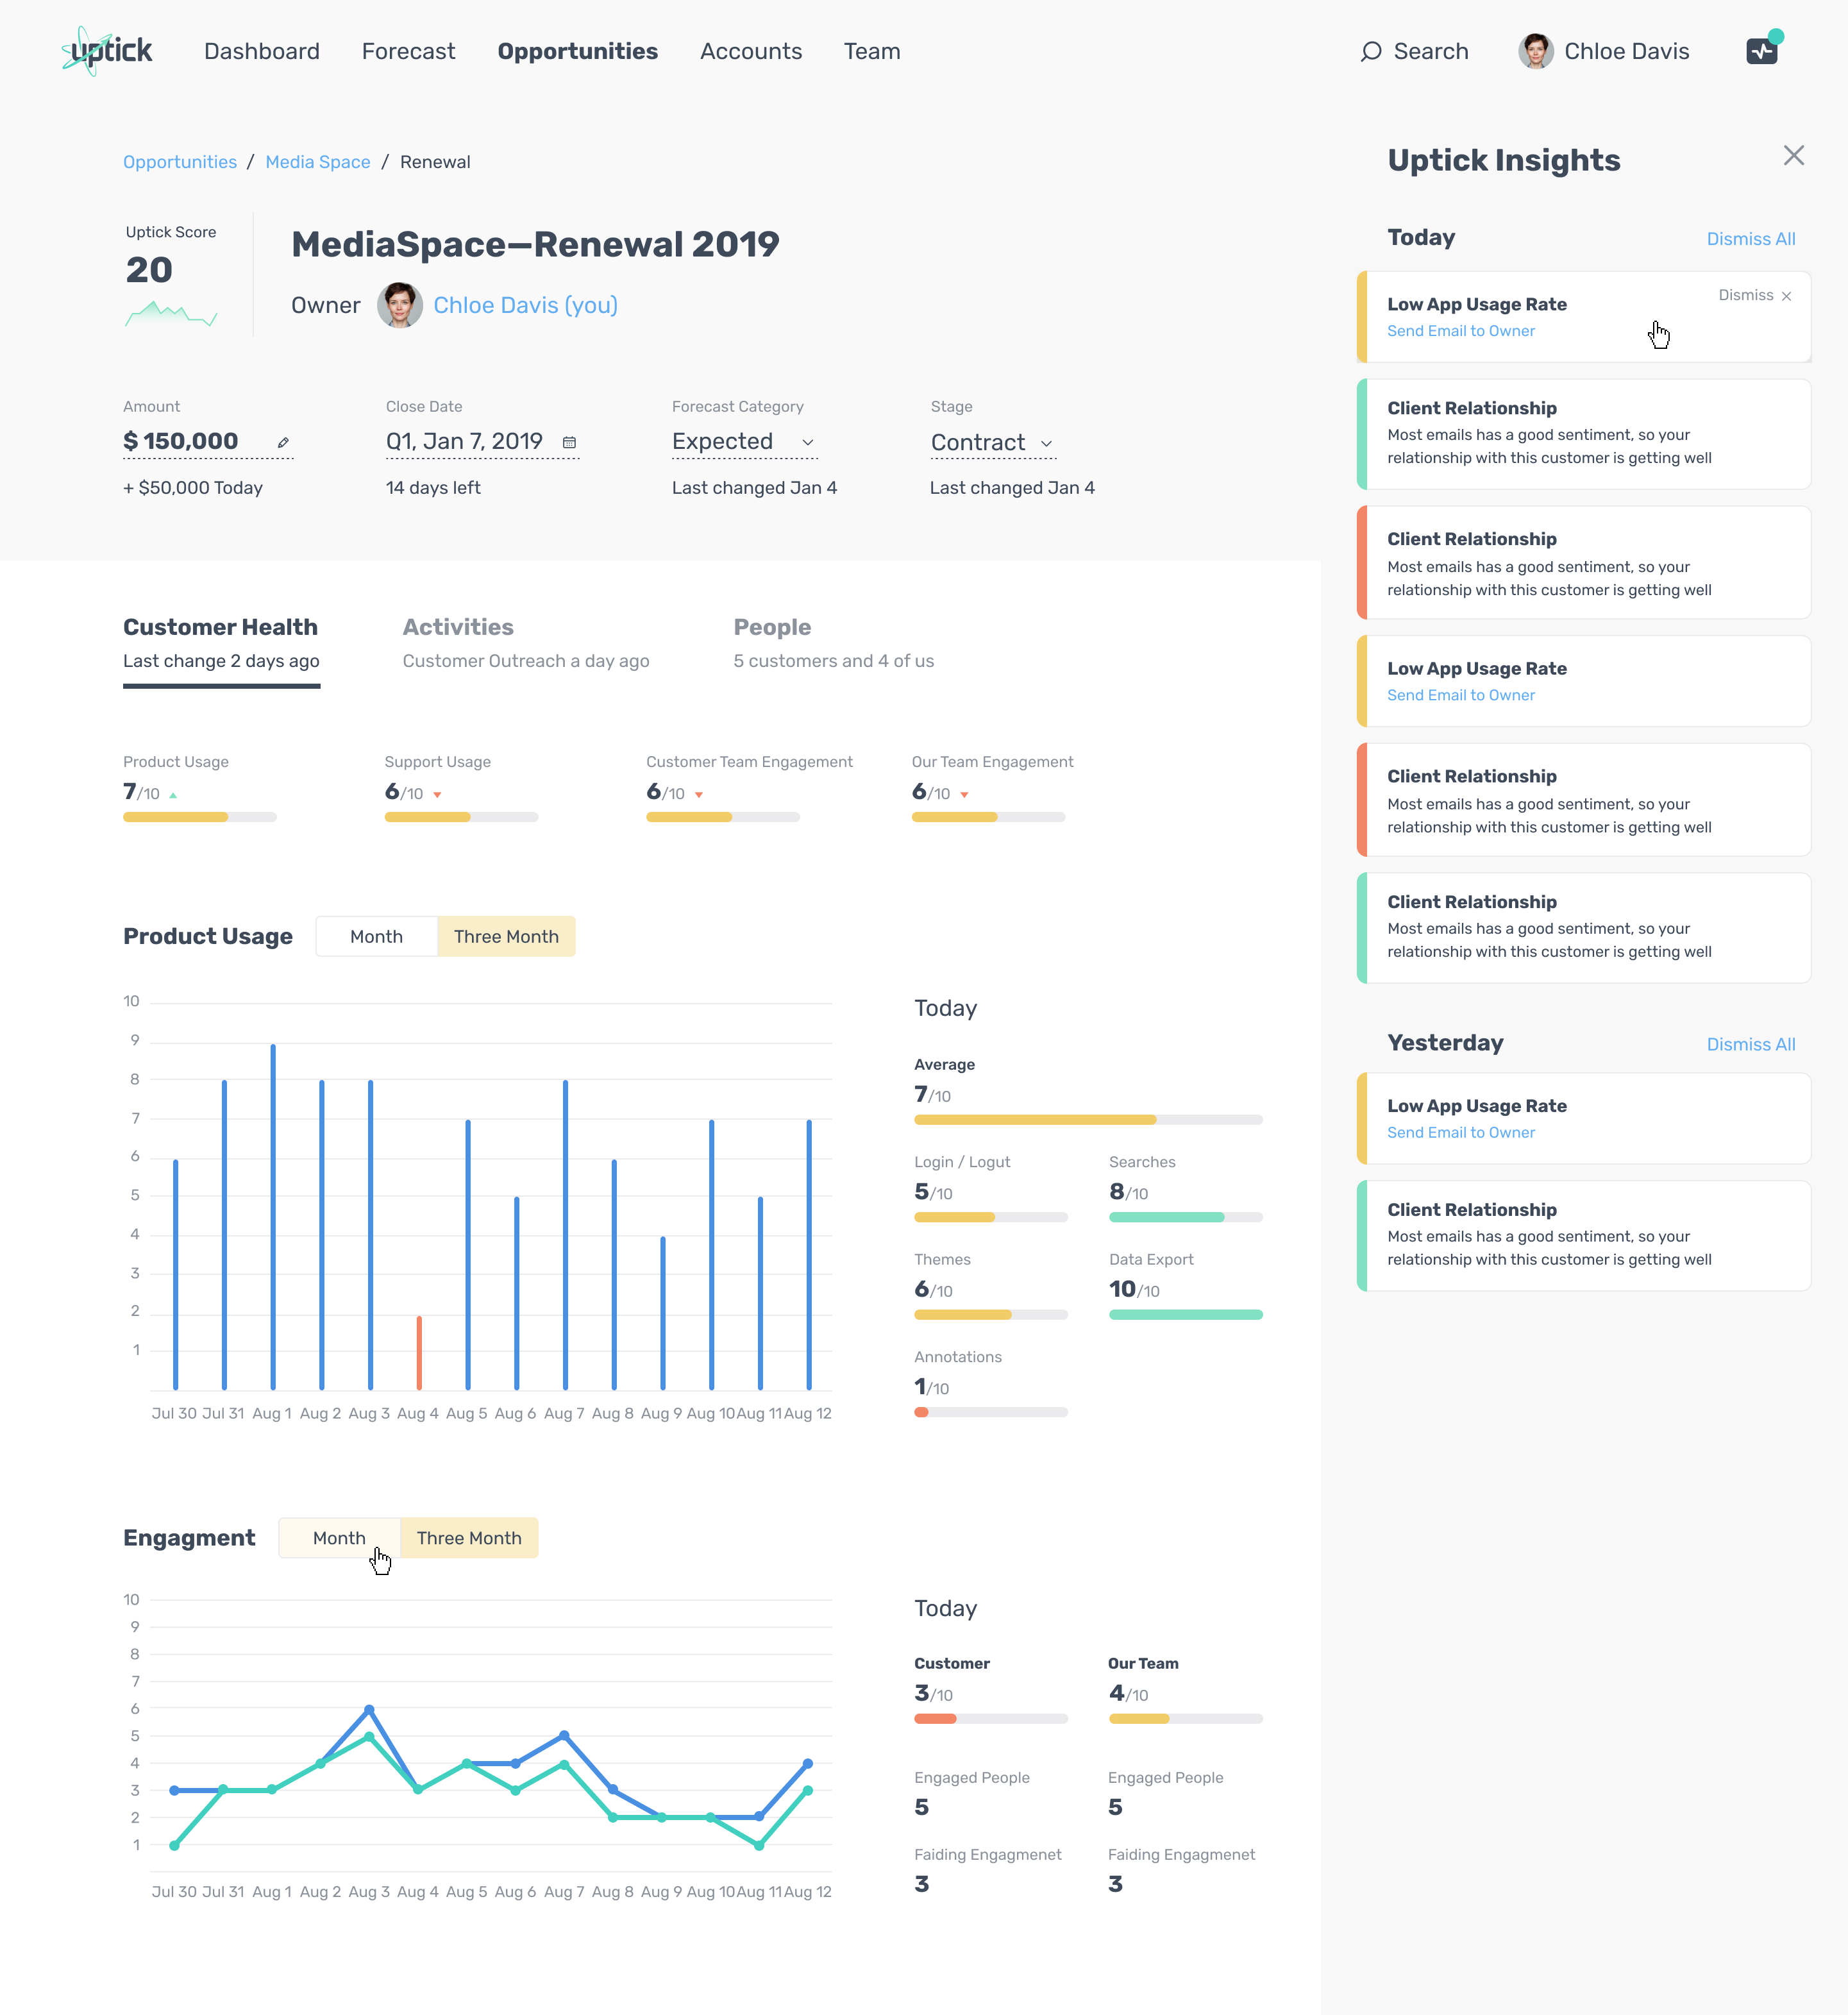
Insights panel — translate signals into actions
The Insights panel turns signals into plain-language guidance and suggests next steps (e.g., low usage rate → contact owner). This bridges ML prediction → user action without forcing users to interpret raw model outputs.
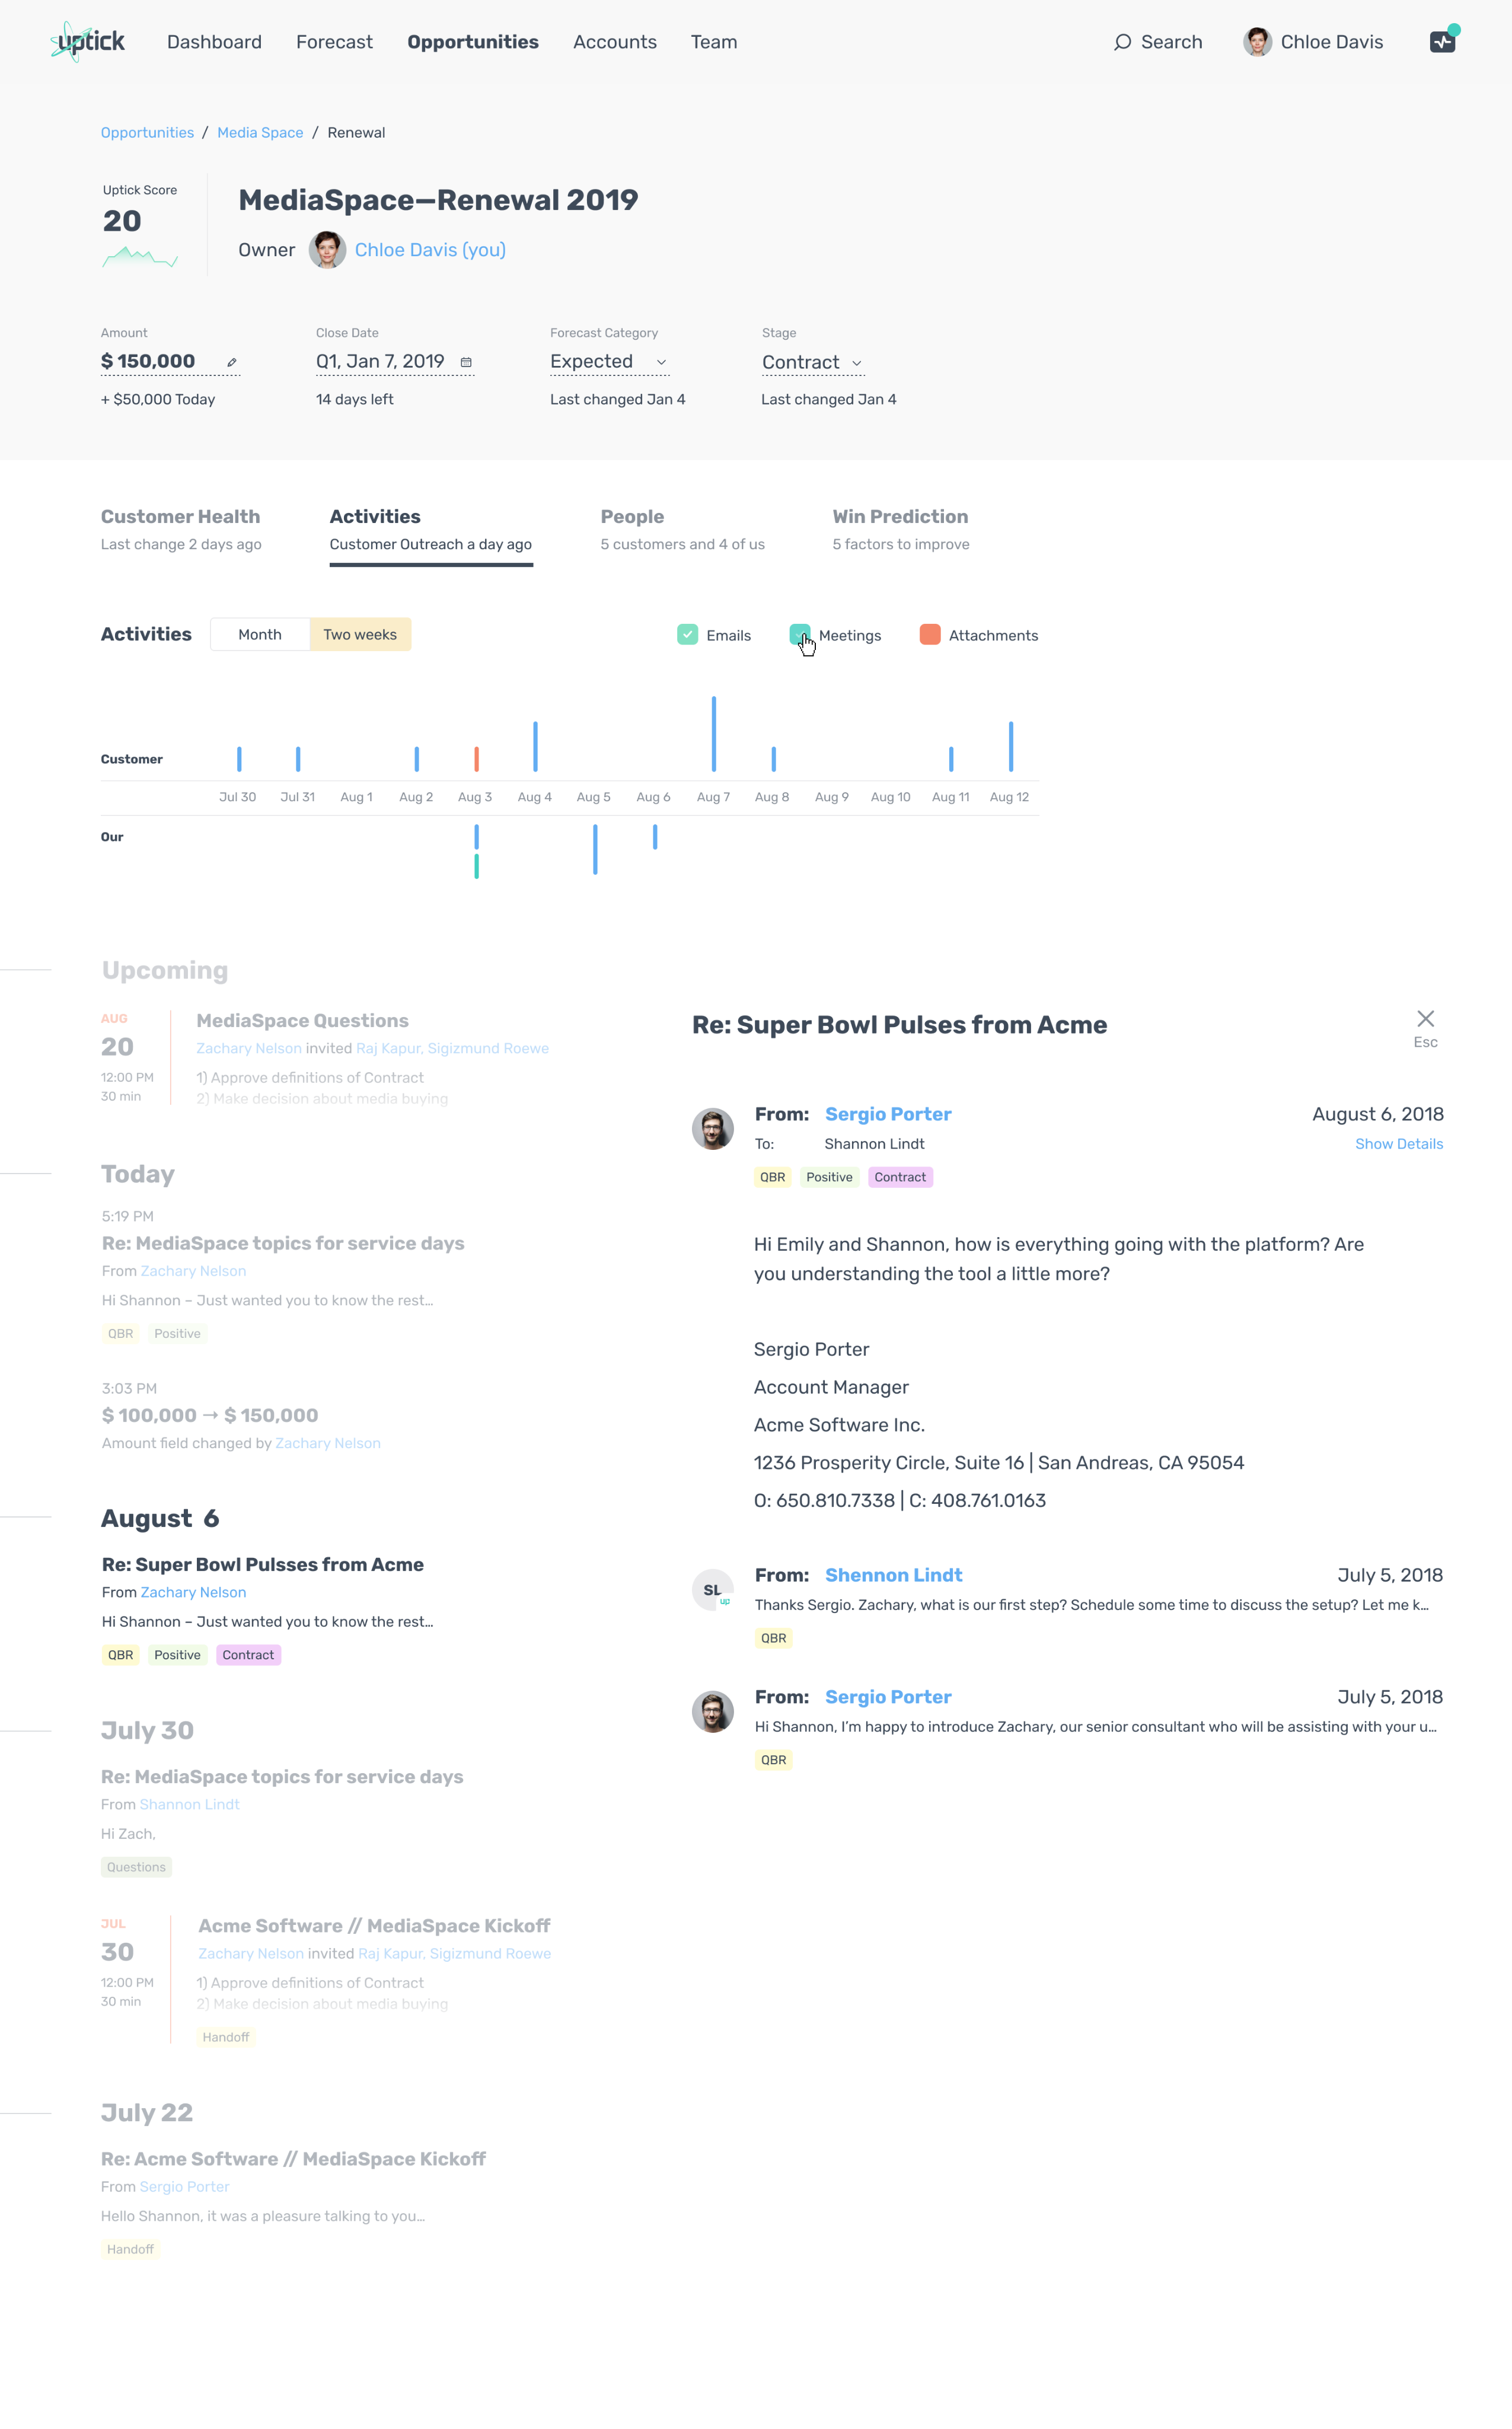
Activities detail — recent context & momentum
Activities are optimized for “what’s happening recently” rather than full-text search (users already do deep search in email clients). Visual grouping helps users read momentum and spot changes quickly.
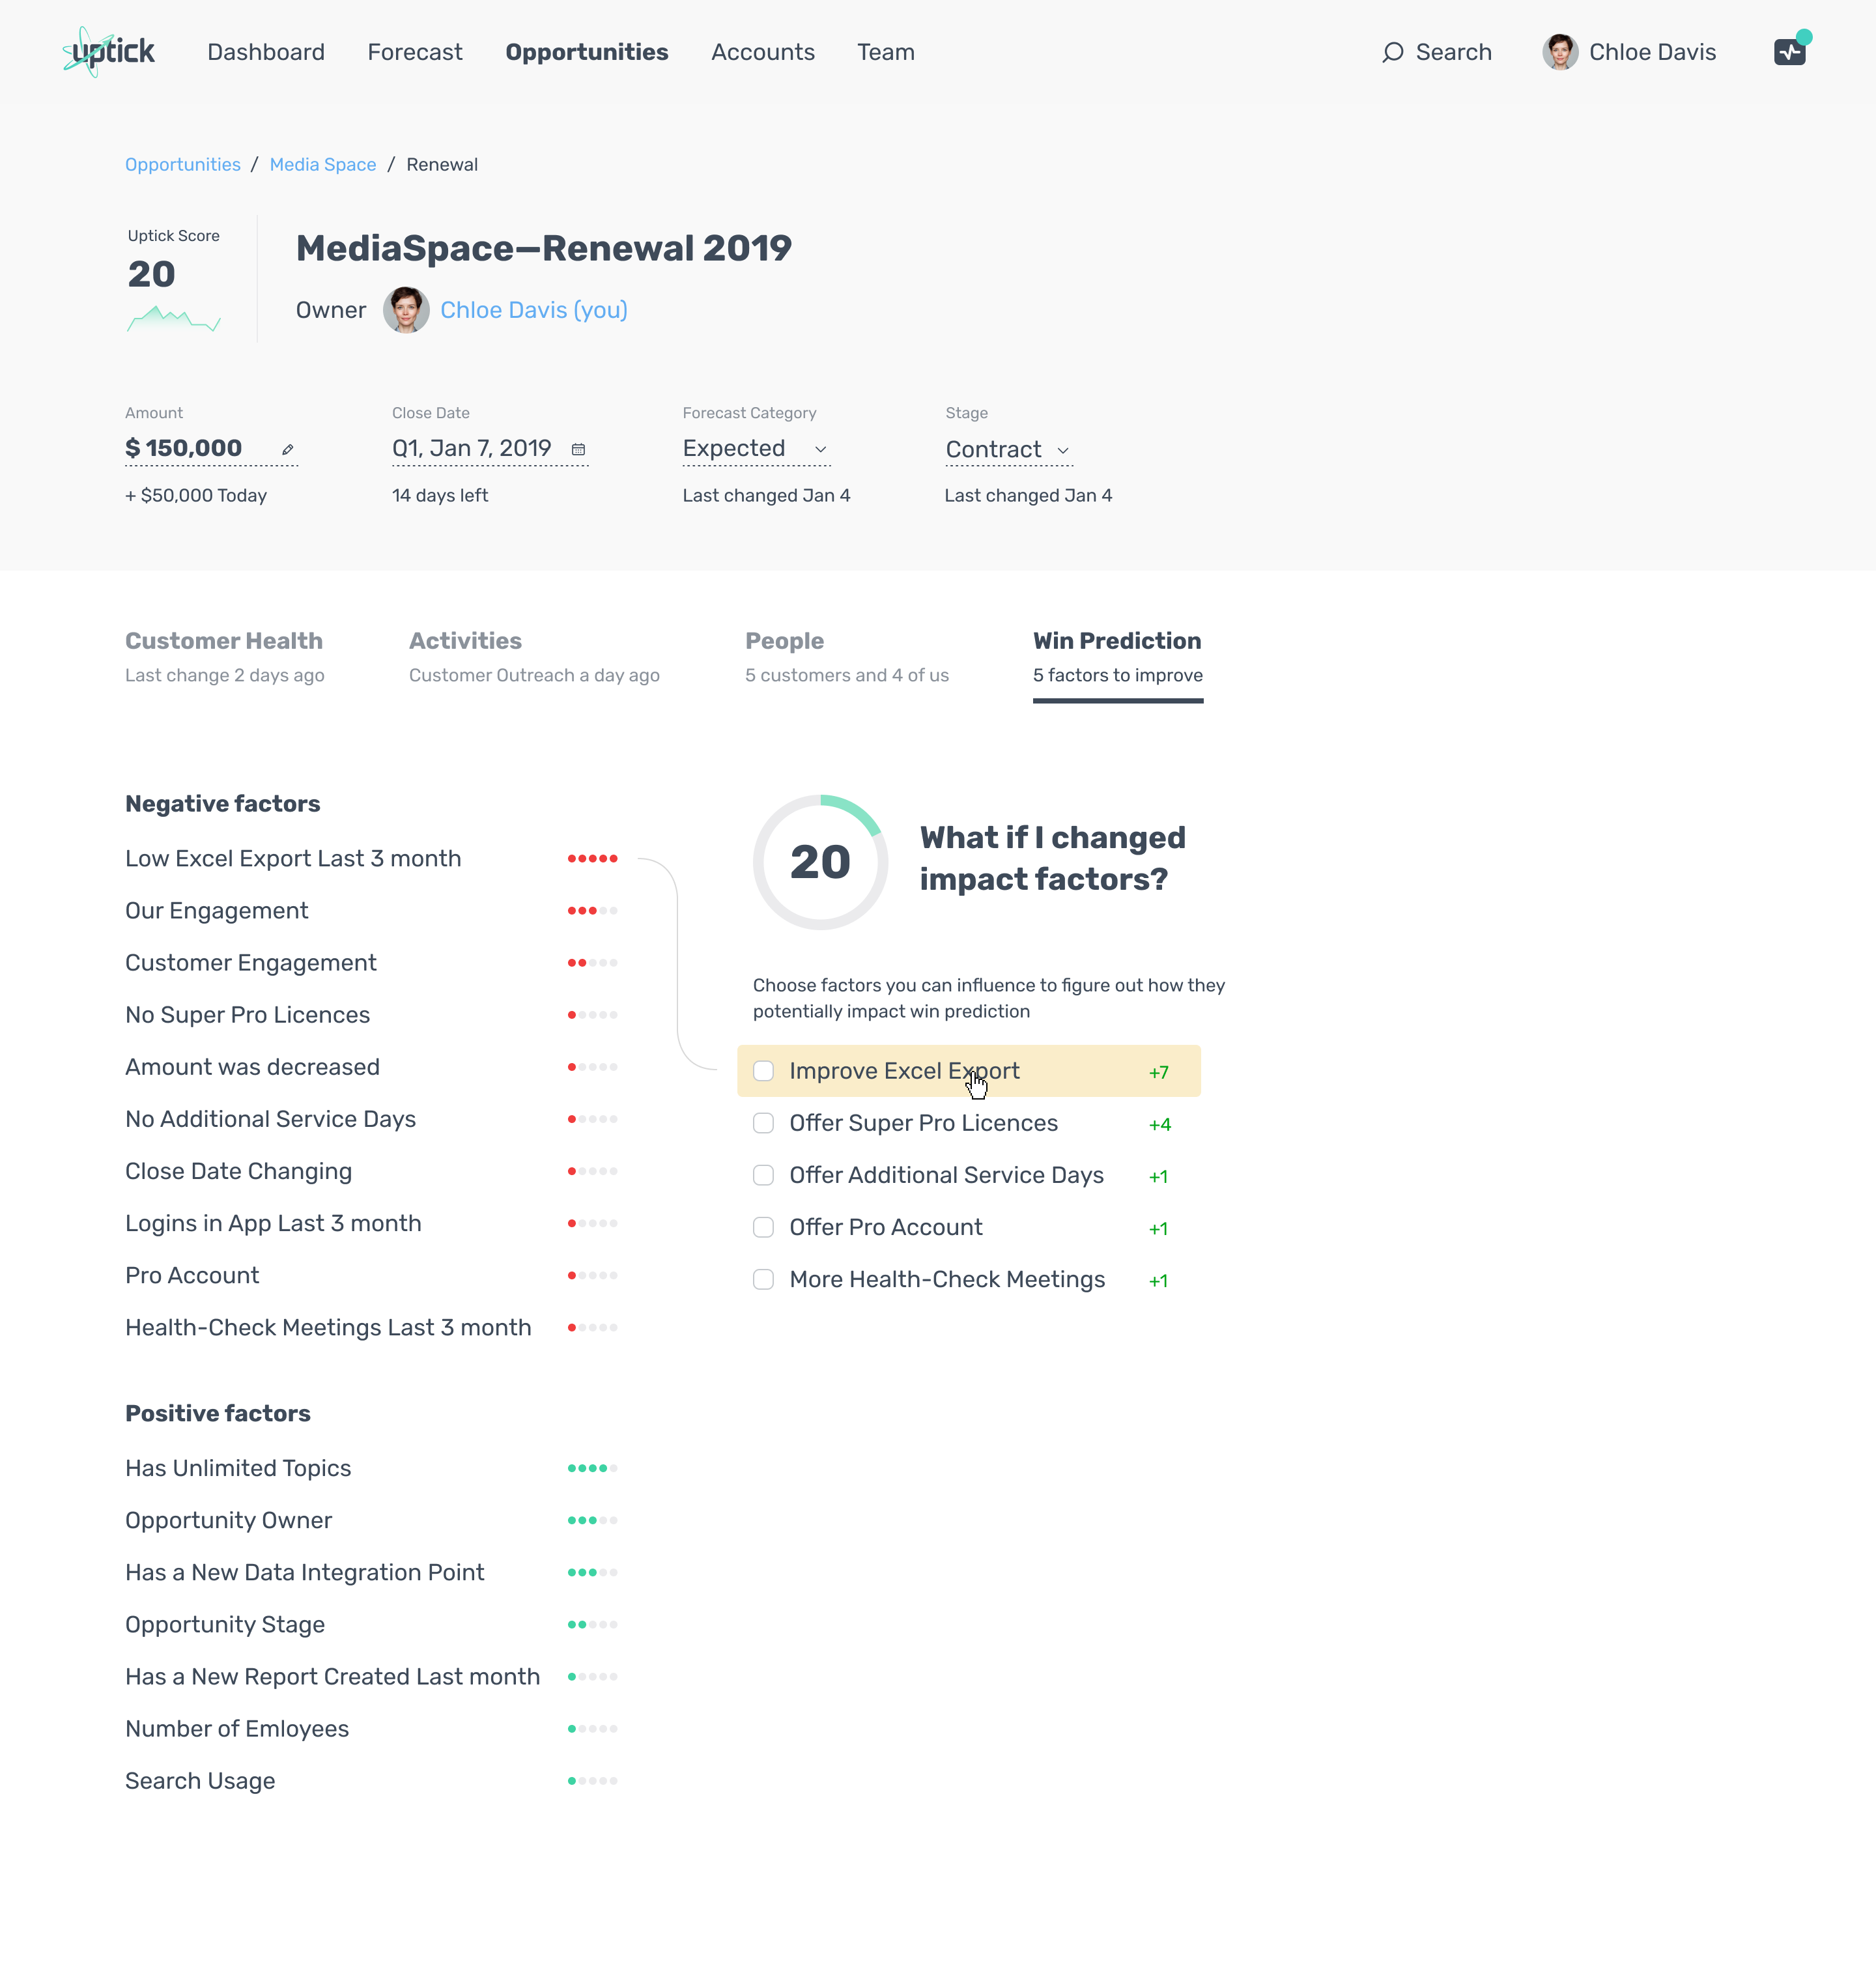
Win Prediction (what-if) — explainability without overload
Instead of treating ML as a verdict, the Win Prediction view exposes drivers and supports planning via a “what-if” interaction. This helps users trust the prediction because they can see levers they might influence.
What I shipped
Accounts + Opportunities layers designed for scanability, segmentation, and prioritization.
360° Customer View to consolidate scattered opportunity context into one decision space.
Uptick Score (1–100) embedded into the 360° workflow; paired with supporting signals (usage/engagement trends, activity context, stakeholder engagement).
EXTRA:
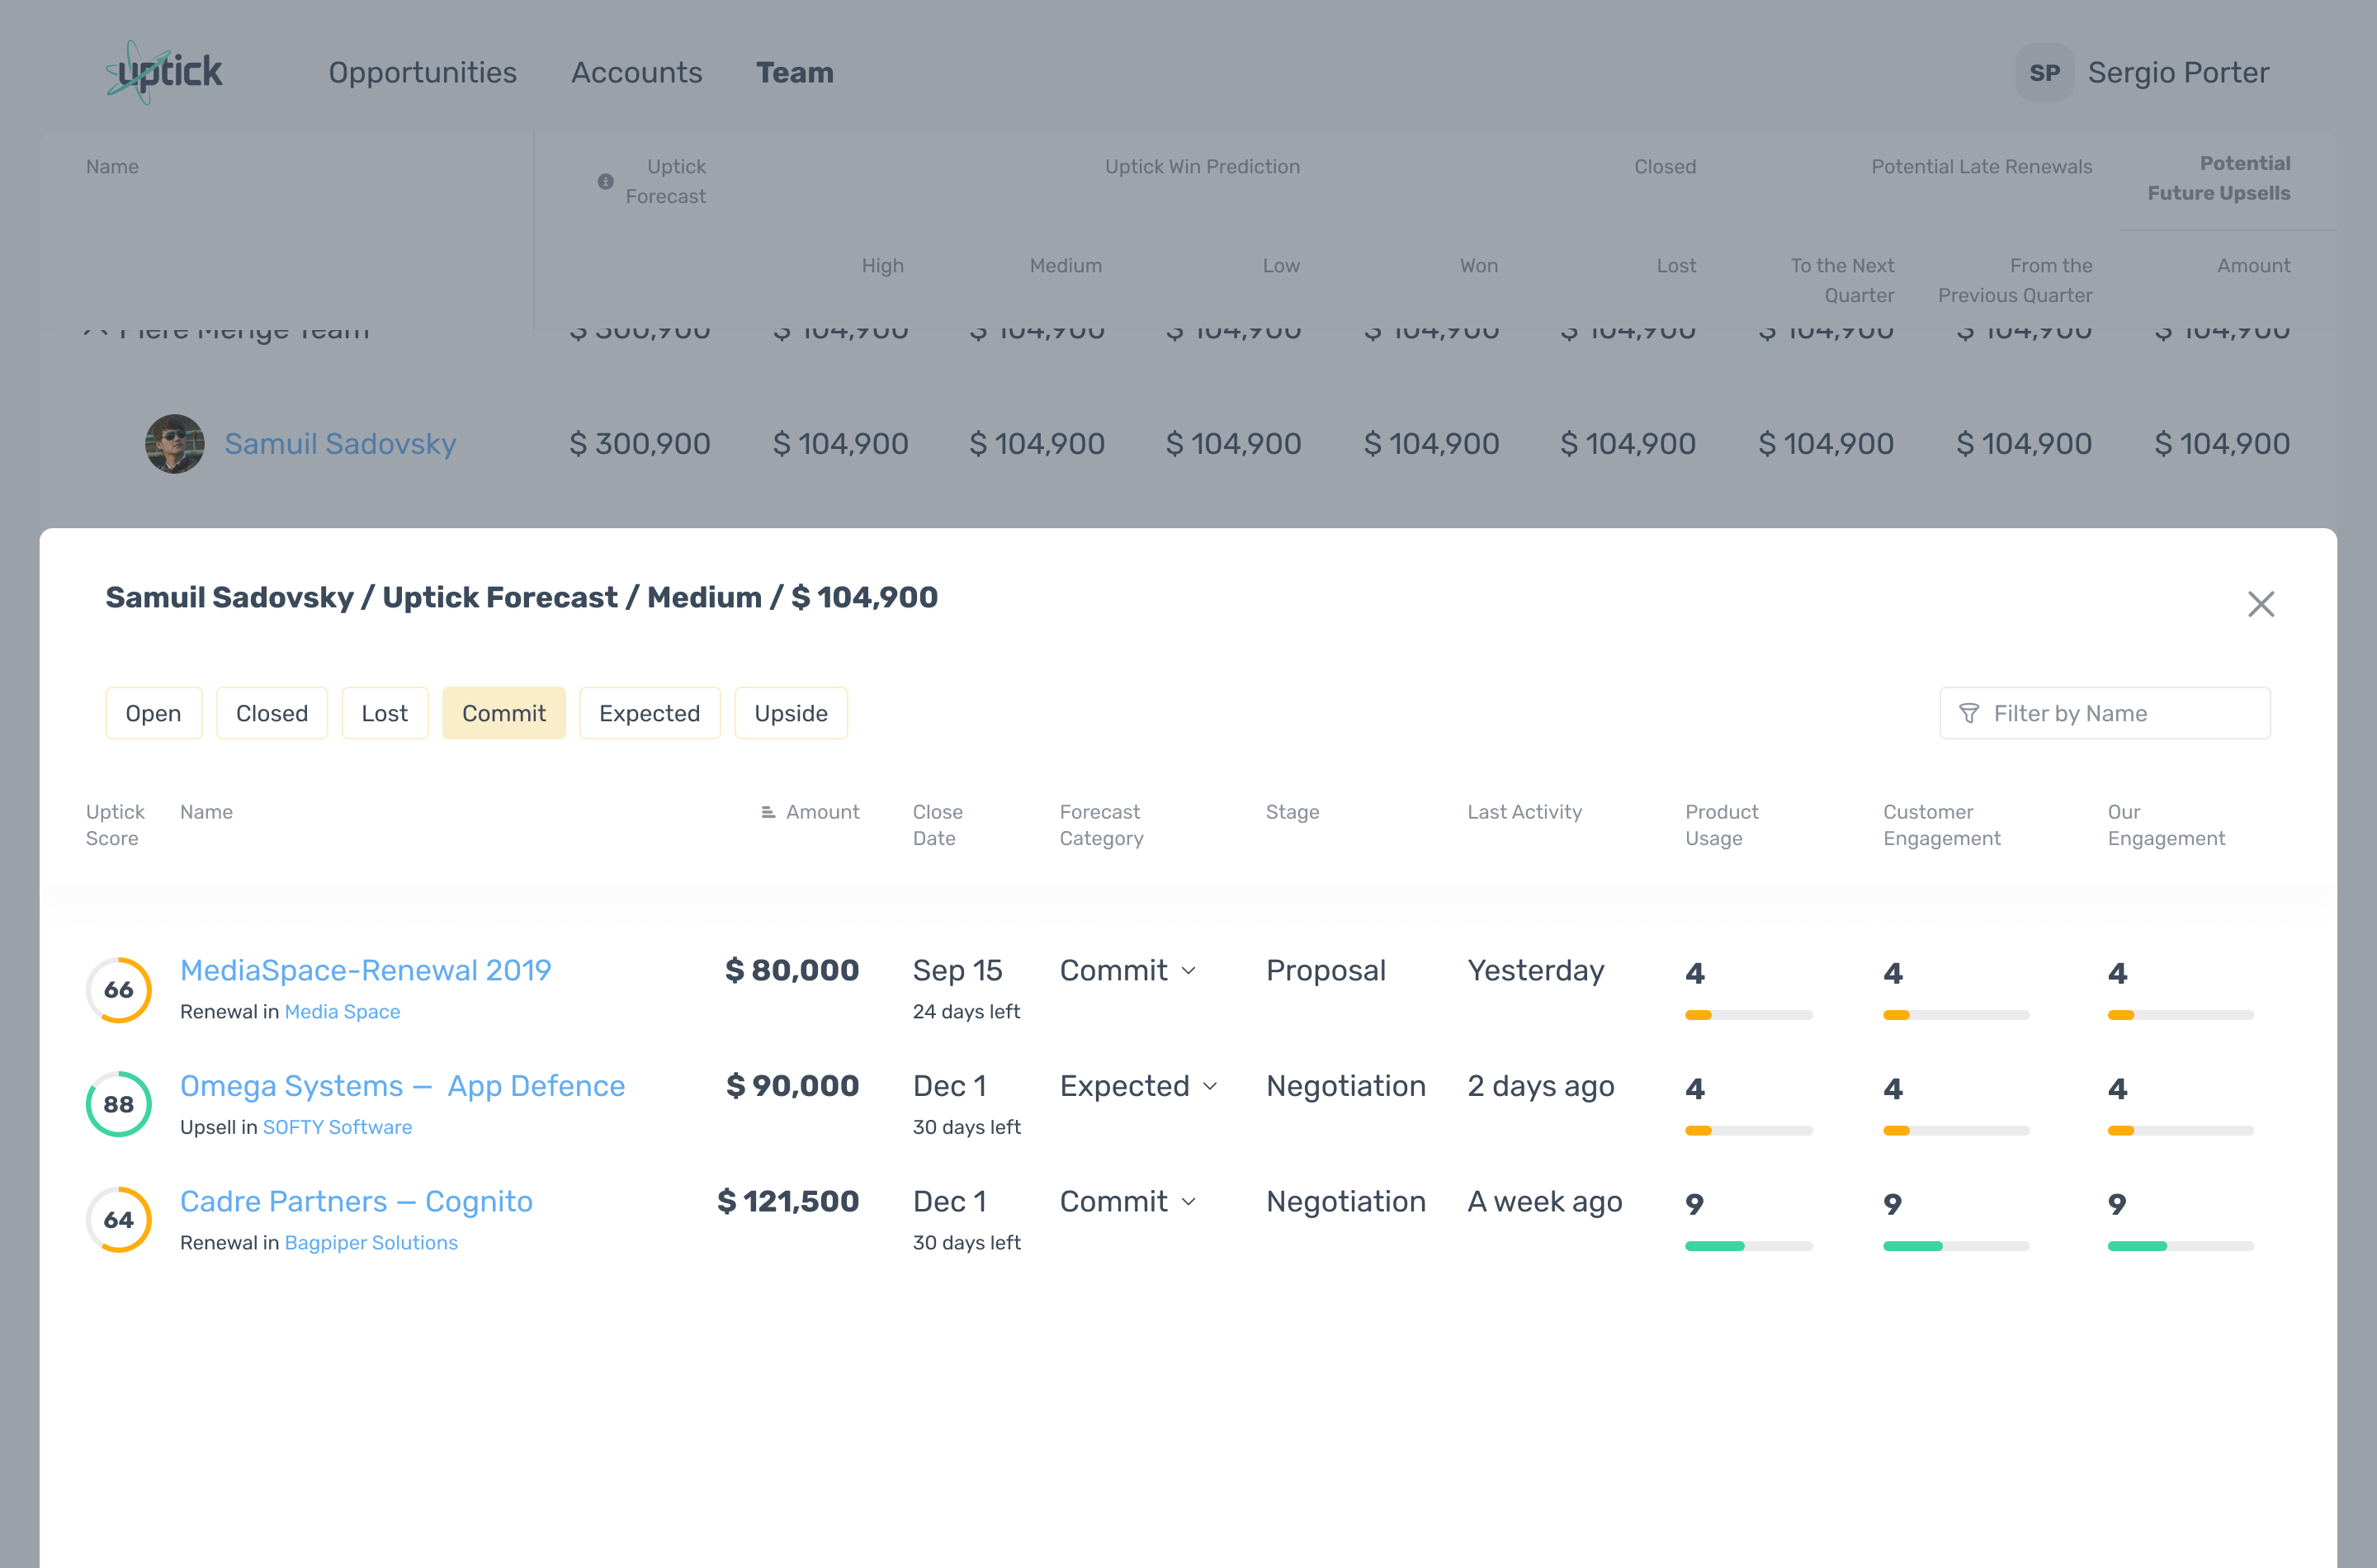
Executive forecasting pivot to segment pipeline (market/team/rep/tier) and compare human forecast vs ML prediction to de-risk quarterly commitments.
Mobile-first CRM experience for field sales (decision signals preserved, not “lite”).
Note: this page focuses on design decisions and patterns. Specific business metrics are not shared publicly.

2025 Max Artemyev
Product designer. Crafting digital products since 2015.
Uptick CRM
Enterprise B2B SaaS • iOS/Android/Web • US market
TL;DR
- Designed CRM workflows that made ML predictions usable and trustworthy for daily decisions and executive forecasting.
- Shipped a 360° Customer View, an embedded Uptick Score (1–100), an exec forecasting pivot, and a mobile-first experience for field sales.
Context
Uptick CRM is built for subscription software companies. A key differentiator is ML-powered prediction of deal health and deal success, used for prioritization and forecasting. The business model relies on enterprise subscriptions justified by better forecasting and decision support.
Sales reps
Sales managers
RevOps
C-level
My role
Product Designer → Senior Product Designer (iOS/Android/Web). I joined early, worked as the only designer for ~2 years, and continued as the company scaled.
- Discovery: interviews, hypothesis testing, synthesis
- Information architecture + interaction design
- Visual design + prototyping
- Handoff, QA, and post-launch iteration
The problem
- Fragmented context: opportunity data scattered across emails/meetings and screens.
- Trust gap for ML: a score is useless if users can’t act on it.
- Field reality: mobile can’t be a “lite” version without decision-critical signals.
Strategy & principles
- Design around decision moments, not around screens.
- Embed ML into workflows with supporting context and drill-down paths.
- Progressive disclosure: scan first → details on demand.
- Smart defaults: ship value early (e.g., predefined filters).
Key trade-off: explainability vs speed. The solution pattern was “fast scan by default + drill-down when needed”.
Walkthrough
Accounts list — prioritize fast
The Accounts list is built for fast prioritization. It combines tiers, potential vs realized value, and health signals (product usage, support usage, engagement) so a rep can quickly decide what deserves attention.
Scanability: key values and health signals are visible without opening details.
Smart defaults: predefined filter presets cover common workflows (e.g., risk, renewals).
Reason, not just ranking: the list explains why an account is “healthy” or “fading”.
Accounts list (tiers + health signals + filter presets).
Account details — progressive disclosure
Account details use tabs (Customer Health / Activities / People / Opportunities) and “teasers” to allow scanning before diving deeper. The goal: speed for daily work, depth when needed.
Scan first: summary health signals and trends visible immediately.
Drill down: details available without turning the page into a “data wall”.
Opportunities list (forecast categories + close dates + health signals).
Opportunities list — reduce spreadsheet fatigue
Opportunities are structured around how sales actually works: amount + close date + stage, plus a clear forecast category (commit/expected/upside). This makes “what to do next” easier than scanning an endless table.
Workflow segmentation: forecast categories match real decision-making.
Actionable signals: quick health/usage indicators provide context without drilling down.
Opportunities list (forecast categories + close dates + health signals).
Opportunity 360° view — one place to decide
The 360° view brings the decision context together: opportunity meta, health signals, trends, and navigation to Activities and People. The Uptick Score is embedded into this workflow rather than living on a separate “AI” page.
Less context switching: fewer jumps between CRM and external tools.
ML inside the workflow: fast scan, with drill-down via health/activity/people context.
Insights panel — translate signals into actions
The Insights panel turns signals into plain-language guidance and suggests next steps (e.g., low usage rate → contact owner). This bridges ML prediction → user action without forcing users to interpret raw model outputs.
Activities detail — recent context & momentum
Activities are optimized for “what’s happening recently” rather than full-text search (users already do deep search in email clients). Visual grouping helps users read momentum and spot changes quickly.
Win Prediction (what-if) — explainability without overload
Instead of treating ML as a verdict, the Win Prediction view exposes drivers and supports planning via a “what-if” interaction. This helps users trust the prediction because they can see levers they might influence.
What I shipped
Accounts + Opportunities layers designed for scanability, segmentation, and prioritization.
360° Customer View to consolidate scattered opportunity context into one decision space.
Uptick Score (1–100) embedded into the 360° workflow; paired with supporting signals (usage/engagement trends, activity context, stakeholder engagement).
EXTRA:
Executive forecasting pivot to segment pipeline (market/team/rep/tier) and compare human forecast vs ML prediction to de-risk quarterly commitments.
Mobile-first CRM experience for field sales (decision signals preserved, not “lite”).
Note: this page focuses on design decisions and patterns. Specific business metrics are not shared publicly.
2025 Max Artemyev
Product designer. Crafting digital products since 2015.